 The "Volatility Coil": BTC/USDT Anchors at 64,910.2 as Bollinger Squeeze Prepares H1 Breakout Drive
 The
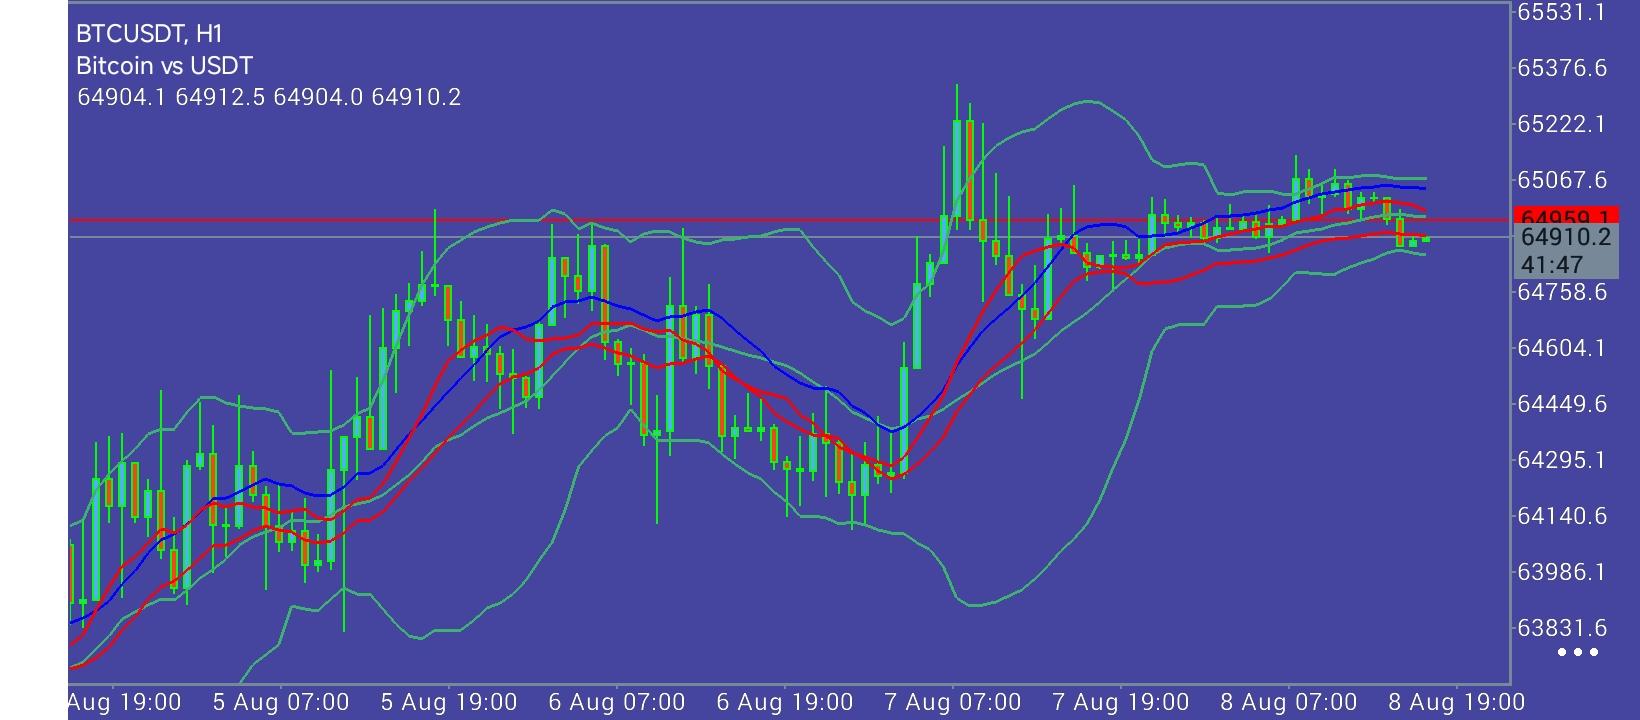
Bitcoin versus USDT (BTC/USD) hourly architecture has entered a state of "Kinetic Compression" between August 4 and August 8, 2026, coiling directly around the
64,910.2 equilibrium handle. The latest H1 candle opened at
64,904.1, establishing a micro-range between
64,904.0 and
64,912.5 as traders brace for the resolution of a multi-day volatility squeeze. The structural evolution over this five-day window breaks cleanly into three distinct phases: an initial impulsive markup from the
63,831.6 base to
64,900.00, a sharp corrective shakeout down to
64,295.1 on August 6, and a powerful V-shaped recovery to
65,376.6 on August 7 that has since settled into tight horizontal consolidation. The short- and medium-term exponential moving averages (EMAs) and the middle Bollinger Band have converged directly at the
64,910.2 axis, creating a technical launchpad where decreasing volume and contracting bands signal an imminent high-velocity expansion. The technical narrative remains fundamentally constructive as long as the higher-low sequence holds above the
64,758.6 demand floor. The initial August 4–5 rally established key structural support at
63,986.1,
64,140.6, and
64,295.1. When the August 6 pullback aggressively flushed price below the EMAs, institutional buyers stepped in at
64,295.1—a critical higher low above the August 4 origin that confirmed structural absorption. The subsequent August 7 impulse erased the entire decline in a single session, driving BTC/USDT to a swing high of
65,376.6 while expanding the upper Bollinger Band. The current consolidation between
64,758.6 and
65,067.6 represents a healthy digestion of those gains rather than institutional distribution. A decisive H1 close above the
65,067.6 trigger level would confirm trend resumption, clearing a direct path toward
65,222.1 and the
65,376.6 supply ceiling, with ultimate extension targets sitting at
65,531.1.
Technical Trend Structure: The 64,758.6 "Pivot Bedrock" and the 65,067.6 "Breakout Gateway" The BTC/USDT H1 chart displays a classical trend-continuation setup characterized by compressed indicator layers and ascending structural pivots.
The 65,067.6 "Breakout Gateway": The immediate line in the sand for bulls. An hourly close above
65,067.6 invalidates the local consolidation cap and unleashes upside expansion toward
65,222.1 and the primary
65,376.6 high.
The 64,758.6 "Pivot Bedrock": The critical intraday floor aligned with the middle Bollinger Band and rising moving averages. Holding
64,758.6 maintains the higher-low structure; a close below exposes
64,604.1 and risks a deeper mean-reversion toward
64,449.6 and
64,295.1.
Indicator Convergence: Moving averages are completely flattened and entangled at
64,910.2, indicating neutral short-term momentum ready to expand violently upon range resolution.
Strategic Trading: Decision Nodes & Tactical Scenarios: Signal Type Entry Trigger Primary Target (TP) Protective Stop (SL) Tactical Rationale Bullish Continuation H1 Close >
65,070.0 65,222.1 / 65,376.6 64,890.0 Volatility breakout play exploiting Bollinger Band expansion above compressed EMA cluster.
Bearish Breakdown H1 Close <
64,750.0 64,604.1 / 64,295.1 64,920.0 Mean-reversion short targeting lower structural support nodes upon loss of mid-band floor.
Key Tactical Milestones: Immediate Resistance: The
65,067.6 handle. Reclaiming this level confirms the bullish flag and opens the path to
65,376.6.
Critical Support: The
64,758.6 handle. Failing to hold this floor invalidates the immediate recovery setup and returns price to range-bound chop down to
64,295.1.
* Phân tích thị trường được đăng ở đây nhằm mục đích nâng cao nhận thức của bạn, nhưng không đưa ra hướng dẫn để thực hiện giao dịch
 Tiếng Việt
 Русский
 English
 Bahasa Indonesia
 Bahasa Malay
 ไทย
ไทย Español
 Deutsch
 Български
 Français
 中文
中文 বাংলা
বাংলা हिन्दी
 Čeština
 Українська
 Română
