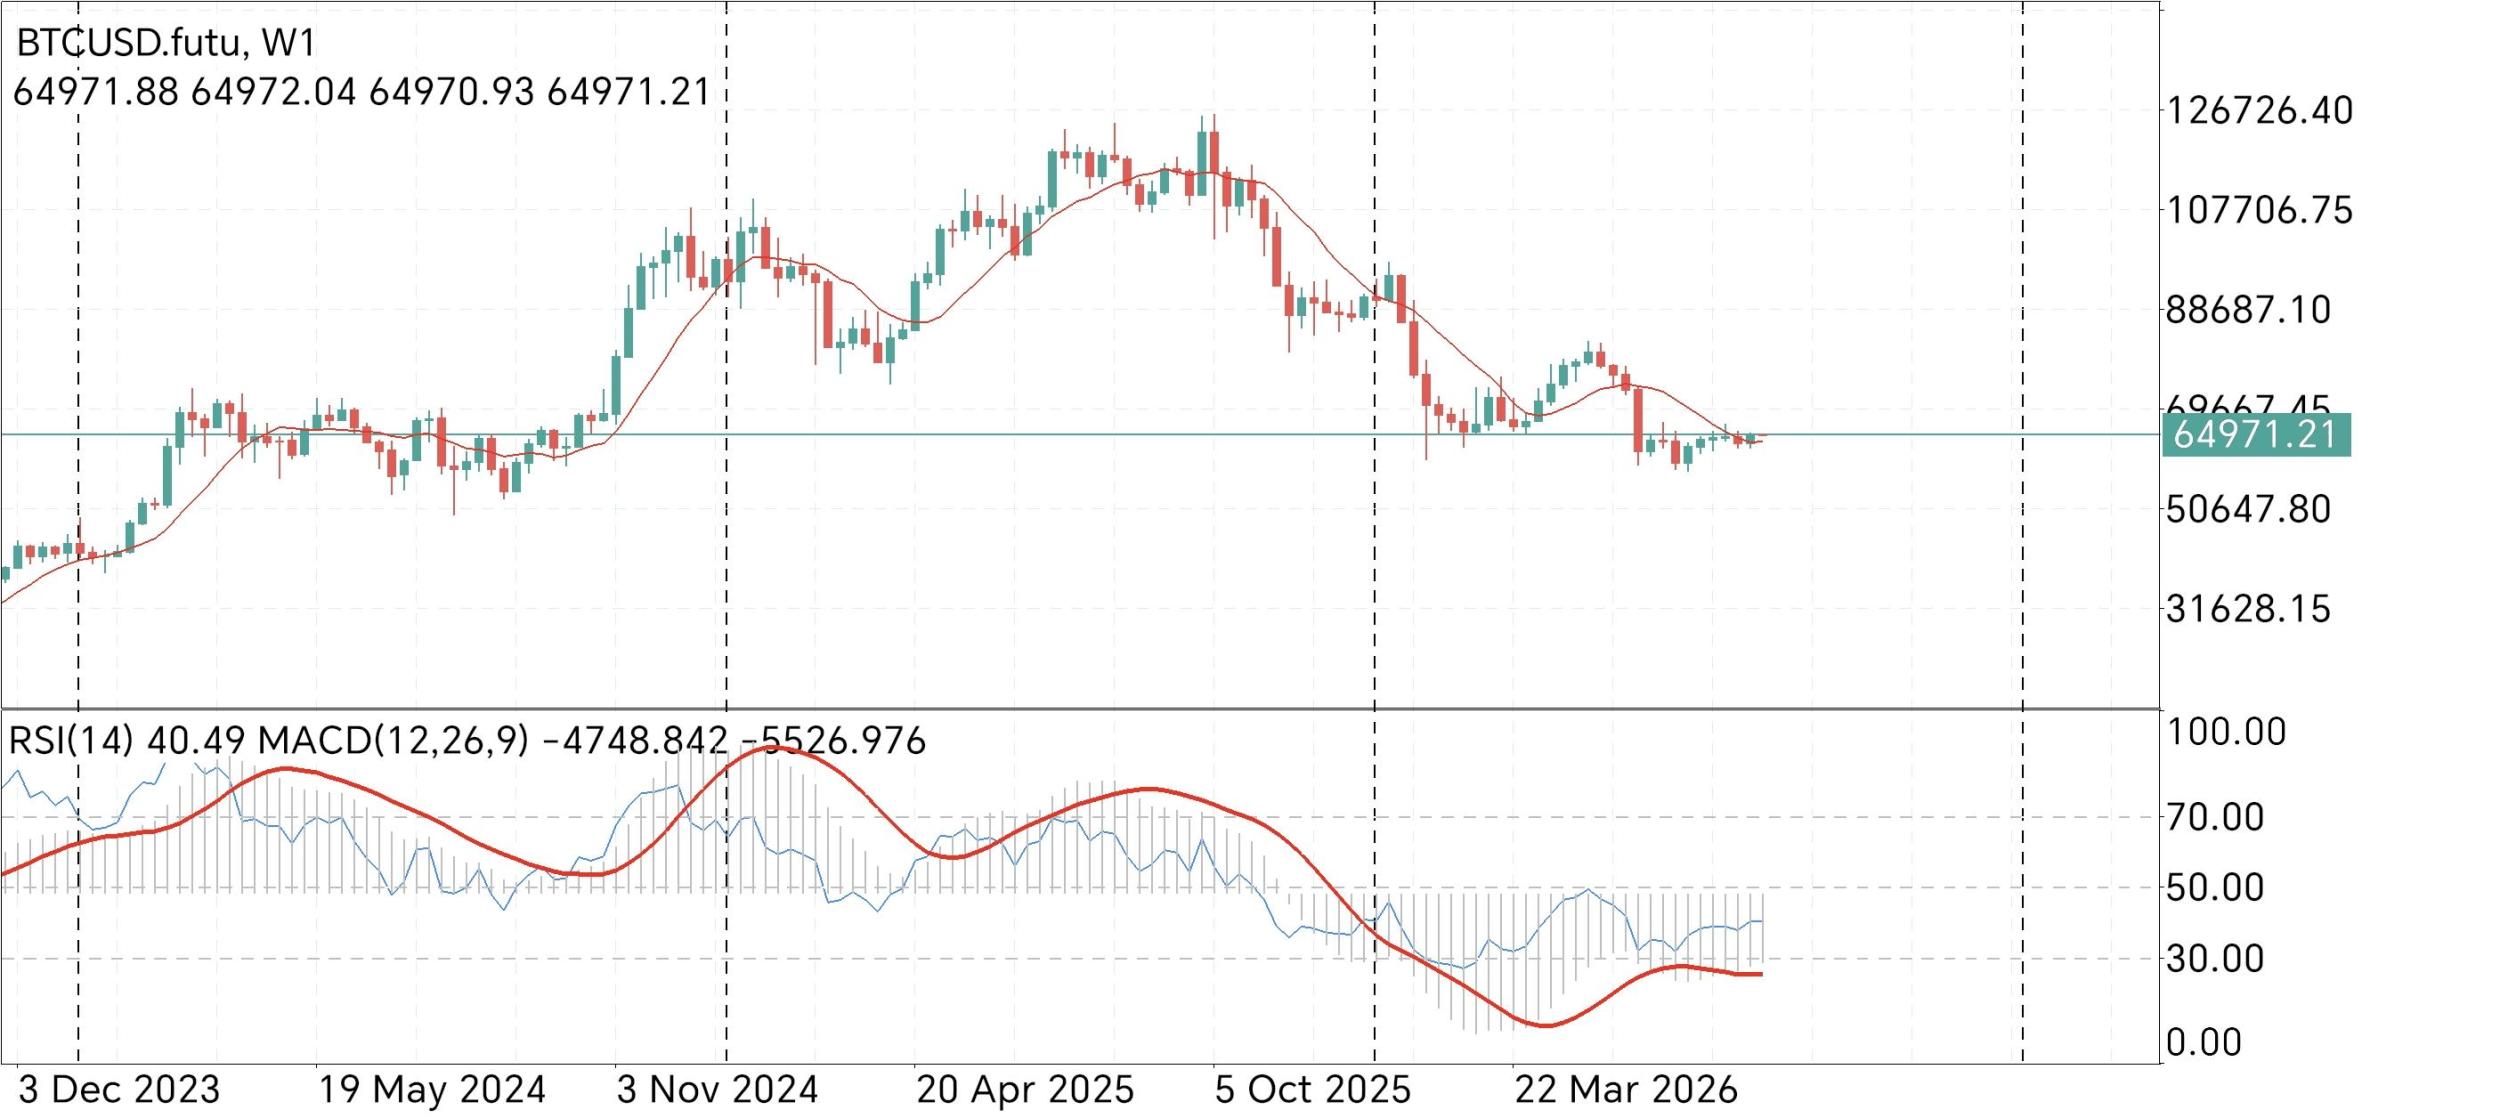
 Weekly Chart Analysis: The Bearish Grip Endures
 A classical analysis of the BTCUSD weekly chart reveals a market firmly under bearish control. The sequence of lower highs and lower lows remains unbroken, defining the primary trend as bearish. Price action is currently testing a critical resistance zone near the $64,750 level, which coincides with a descending trendline that has capped rallies since the 2025 peak and a prior structural break of structure (BOS) around $66,000 . This level represents a significant barrier; a sustained break above it would be the first sign of a potential trend shift. Conversely, failure here would reinforce the bearish structure. The nearest major support lies at the recent swing low around $61,500, with a deeper and more critical support zone located at $52,000-$55,000, identified as the "worst-case" downside target by analysts and a historical bear market floor .
Potential Scenarios: Divergence vs. Continuation 1. Bullish Scenario (Low Probability): A strong weekly close above the key resistance at $66,000-$67,300 would invalidate the current bearish structure and signal a potential trend reversal . This move would likely be preceded by a bullish divergence on the RSI, where price makes lower lows but the indicator makes higher lows, a condition some analysts are currently observing . However, a divergence alone is not sufficient for a trade; it requires confirmation through a structural breakout. The first bullish target on such a move would be a retest of the psychological $80,000-$83,000 resistance zone . 2. Bearish Scenario (High Probability): If BTC fails to overcome the resistance at $64,750-$66,000, this would confirm another lower high and reinforce the bearish trend. A rejection here could accelerate selling pressure, with the immediate target being a break below the $61,500 support. A confirmed breakdown below this level would likely trigger a move toward the major support zone at $52,000-$53,000, a projection supported by the measured move of a potential head and shoulders pattern . In this scenario, the downtrend continuation is the path of least resistance until a clear bullish reversal pattern emerges.
Trade Setup Summary A prudent approach for the week ahead is to wait for a definitive breakout or breakdown from the current consolidation. For a bearish setup, a daily or weekly close below the $61,500 level would offer a high-probability selling opportunity, with a stop-loss placed above the recent swing high at approximately $65,000. The initial profit target would be the $55,000 area. A bullish trade would only be considered after a confirmed weekly close above the $66,000-$67,300 resistance zone, invalidating the current bearish bias. This move would suggest a potential shift in market structure, allowing for a long position targeting the $80,000 level as a first major objective.
Summary In conclusion, the weekly chart remains in a bearish trend, characterized by lower lows and a significant resistance zone at $64,750-$66,000. The 50-week moving average and Ichimoku Cloud, key indicators for trend health, are also acting as resistance, suggesting the path to a sustained bull market is not yet clear . Until a clear breakout above these key levels is observed, the market structure favors the downside, with a potential move toward the $52,000-$55,000 support area. The medium-term outlook is bearish, and patience is required to wait for a decisive, high-probability trade setup.
* Phân tích thị trường được đăng ở đây nhằm mục đích nâng cao nhận thức của bạn, nhưng không đưa ra hướng dẫn để thực hiện giao dịch
 Tiếng Việt
 Русский
 English
 Bahasa Indonesia
 Bahasa Malay
 ไทย
ไทย Español
 Deutsch
 Български
 Français
 中文
中文 বাংলা
বাংলা हिन्दी
 Čeština
 Українська
 Română
