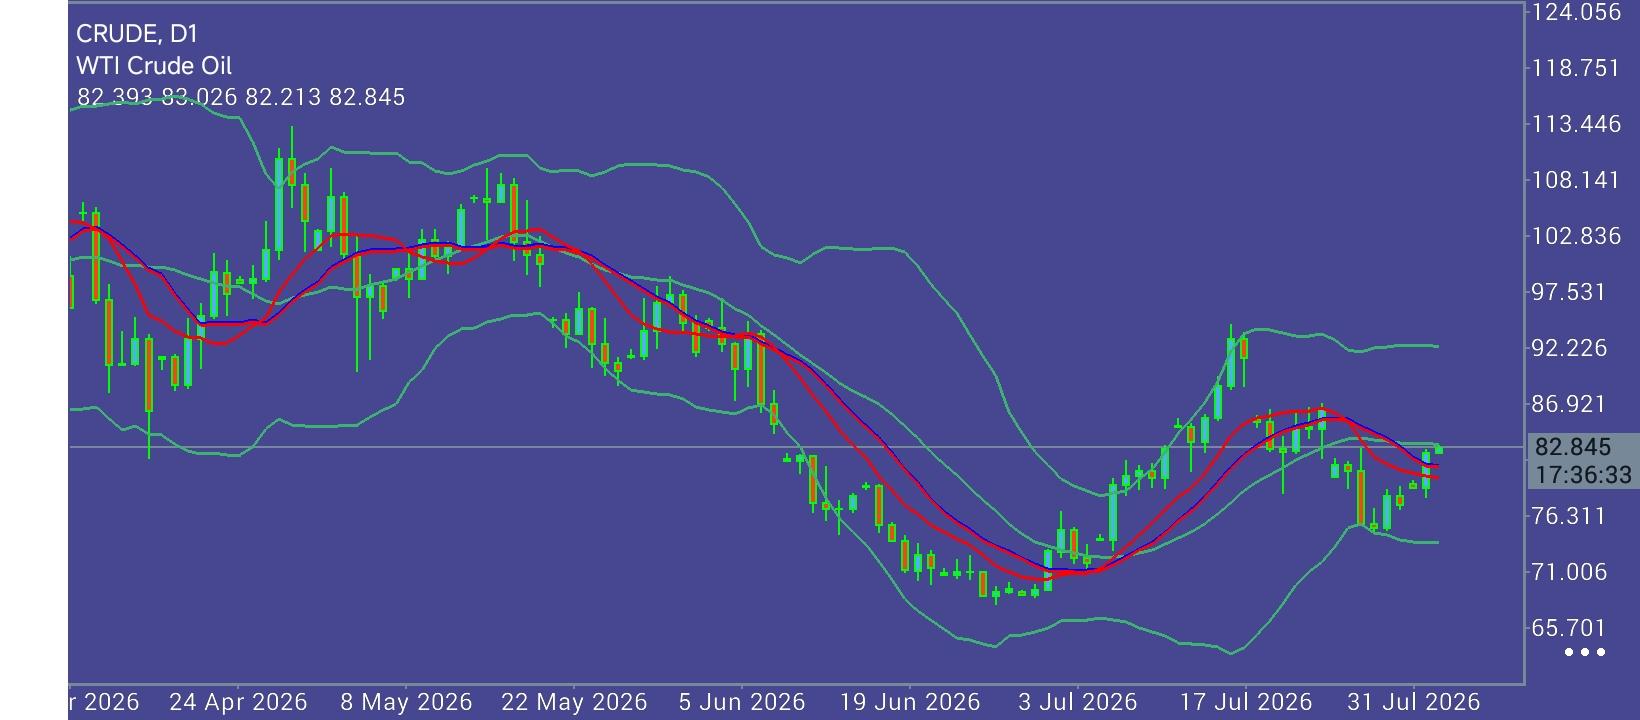
 The "Volatility Squeeze": WTI Crude Compresses at $82.93 as Declining EMAs and Retracement Levels Block Recovery
 WTI Crude Oil (
CL) is consolidating within a tight daily range on August 4, 2026, printing at
$82.935 following an open at
$82.393, an intraday peak of
$83.026, and a session low of
$82.213. The broader technical structure from late March through early August resolves into a completed five-wave bearish cycle followed by a corrective recovery that has encountered severe technical friction at a major confluence zone. The initial phase (late March to June 26) represented an aggressive impulsive decline, driving prices down from the
$105.238 macro peak to a capitulation low of
$70.758. This drop featured impulsive breaks below horizontal levels at
$100.928,
$96.618, and
$92.308, with the breakdown below
$92.308 marking a crucial role reversal from support to overhead resistance. Falling Exponential Moving Averages (EMAs)—represented by short- and medium-term dynamic trendlines—continuously rejected relief rallies, while lower Bollinger Band expansion confirmed sustained downward momentum until seller exhaustion surfaced at
$70.758 via a long-wicked bullish reversal candle. The subsequent corrective phase (June 26 to July 24) launched a structured sequence of higher lows (
$70.758,
$75.068, and
$79.378) and higher highs (
$79.378,
$83.026, and
$92.308), lifting price back above the short-term EMAs as Bollinger Bands shifted into an expansion phase. However, the advance halted abruptly at
$92.308 on July 24, precisely touching the upper Bollinger Band, the 50% Fibonacci retracement of the broader
$105.238–$70.758 decline, and the historical supply zone from early May. The resulting long upper wick marked intense profit-taking, forcing price into a pullback toward
$79.378 before stabilizing at current levels. As volatility compresses into a symmetrical triangle pattern between converging daily EMAs and rising structural trendline support, traders face a pivotal decision node defined by fundamental macro catalysts—such as shifting U.S. Dollar strength, demand risks, and inventory or OPEC announcements—which are poised to trigger the next directional breakout.
Technical Trend Structure: The $83.500 EMA Barrier vs. The $79.378 Structural Base The daily chart structure exhibits a classic volatility squeeze (Bollinger Band contraction) directly at the
38.2% Fibonacci retracement of the
$92.308–$70.758 wave, creating a well-defined technical boundary.
The $83.500–$84.000 "Dynamic Resistance Gateway": The primary overhead barrier is formed by converging short- and medium-term EMAs around
$83.500, reinforced by the
$84.000 horizontal pivot (former April support turned resistance). A decisive daily close above
$84.000 invalidates the immediate bearish bias and targets
$87.998,
$92.308, and eventually higher swing targets at
$96.618.
The $79.378–$78.500 "Demand Bedrock": Immediate structural defense rests at
$82.213 and
$81.000, but the critical line in the sand for buyers is
$79.378. A daily close below
$79.378 breaks the higher-low sequence from July, confirming a bearish continuation toward
$75.068 and a potential retest of the
$70.758 cycle low.
Indicator Matrix: Bollinger Bands have contracted significantly, signaling imminent volatility expansion. Relative Strength (RSI) remains neutral near 50, providing ample runway for a directional move in either direction once boundaries break.
Strategic Trading: Decision Nodes and Structural Levels Signal Type Entry Trigger Primary Target (TP) Protective Stop (SL) Tactical Rationale Bearish Rejection (Primary) Failure at
$83.500 / $84.000 $79.378 / $75.068 Above
$84.500 Aligning with the dominant macro downtrend and EMA resistance convergence.
Bullish Breakout (Secondary) Daily Close >
$84.000 $87.998 / $92.308 Below
$82.200 Breakout play targeting Wave C extension following Bollinger Band expansion.
Key Tactical Milestones: Immediate Resistance: Session high of
$83.026, followed by the EMA convergence zone at
$83.500–$84.000.
Critical Support: Session low of
$82.213, followed by the structural swing pivot at
$79.378.
* Phân tích thị trường được đăng ở đây nhằm mục đích nâng cao nhận thức của bạn, nhưng không đưa ra hướng dẫn để thực hiện giao dịch
 Tiếng Việt
 Русский
 English
 Bahasa Indonesia
 Bahasa Malay
 ไทย
ไทย Español
 Deutsch
 Български
 Français
 中文
中文 বাংলা
বাংলা हिन्दी
 Čeština
 Українська
 Română
