Based on the provided 1-hour chart for
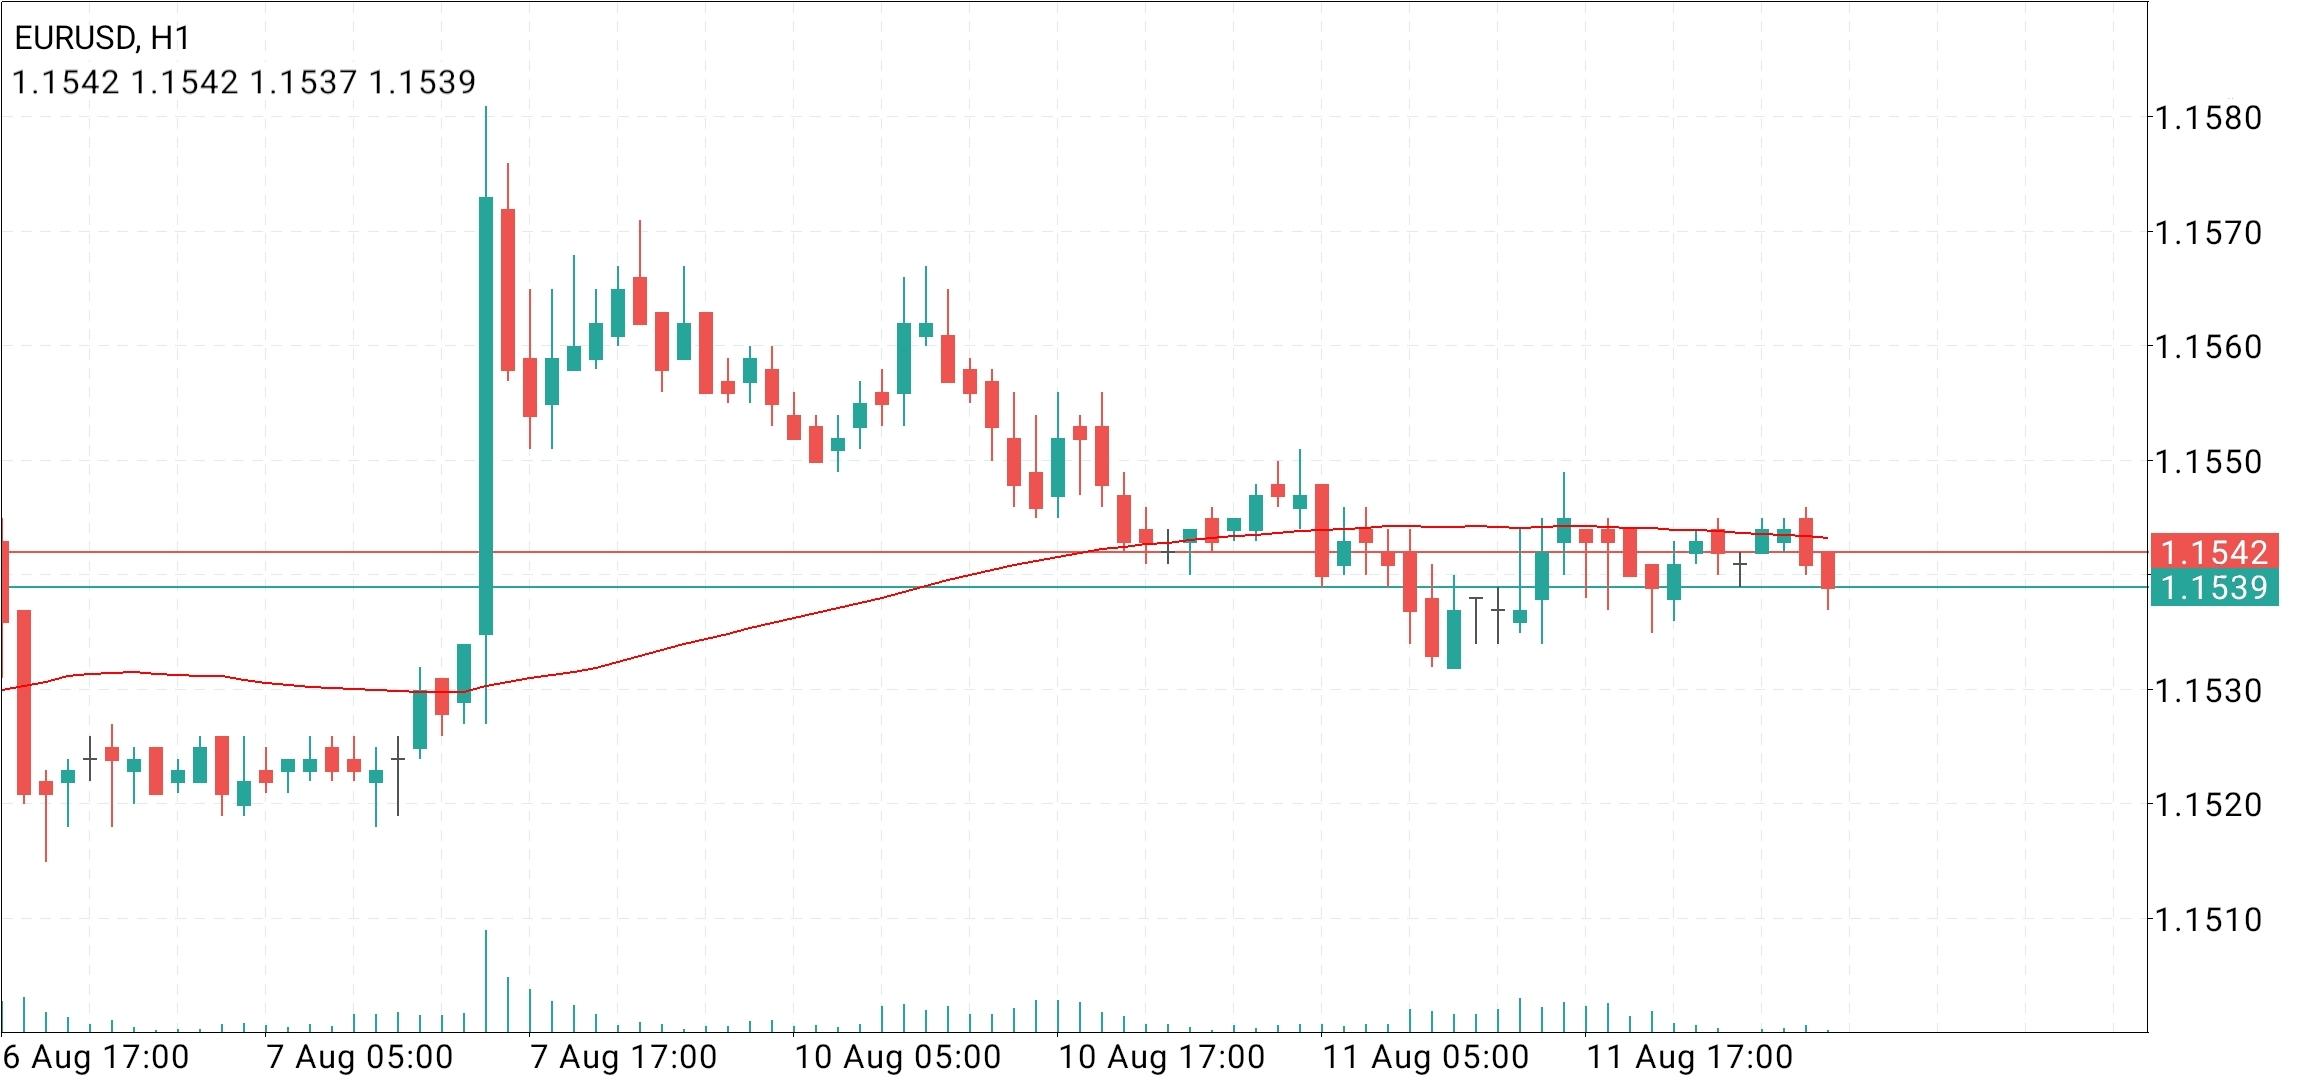
EURUSD, the pair is currently trading at approximately 1.1539, showing a mild bearish drift after failing to sustain gains above 1.1550. The price has been in a broad consolidation range between roughly 1.1510 and 1.1580 since August 6, with the most recent price action showing a gradual decline from the upper end of this range toward the middle. The overall structure remains neutral-to-bearish in the short term, as sellers have successfully capped upside attempts near 1.1550–1.1560.
Key Support and Resistance Levels Immediate resistance is now defined at 1.1550, with a stronger ceiling near 1.1560–1.1570—the latter representing the high from August 10 and a key barrier for further bullish momentum. A decisive break above 1.1570 would open the door toward 1.1580, but for now, sellers are likely to defend this zone. On the downside, 1.1530 acts as the first layer of support, followed by 1.1520 and the stronger floor at 1.1510. A breakdown below 1.1510 would signal a shift in momentum and could trigger a retest of the recent lows near 1.1500–1.1490.
Momentum and Oscillator Context The recent price action shows a gradual decline from 1.1570 to 1.1539, with small bearish candles indicating controlled selling rather than panic. This suggests that sellers are slowly gaining control, but the absence of sharp downward moves indicates a lack of aggressive conviction. If RSI were available, it would likely be declining from the 55–60 range toward the 45–50 zone, reflecting a loss of bullish momentum. The fact that the price is still above 1.1520 suggests that buyers are attempting to defend this level, but the repeated rejection at 1.1550–1.1560 favors the bears in the short term.
Trading Plan For short entries, consider selling near the 1.1550–1.1560 resistance zone with a stop-loss placed above 1.1570 and targeting a retest of 1.1539 or 1.1530. Alternatively, if price breaks below 1.1510, consider selling with a stop-loss above 1.1520 and targeting 1.1500 and 1.1490. For long positions, wait for a decisive close above 1.1570 on the hourly chart, with a stop-loss below 1.1560 and an initial target of 1.1580–1.1590. However, given the broader range-bound context and the recent bearish drift, longs should be treated as counter-trend trades with smaller position sizes and tighter stops.
Forecast and Key Triggers Looking ahead, a break above 1.1570 would confirm short-term strength and likely trigger a squeeze toward 1.1580–1.1590, potentially signaling a larger recovery if momentum builds. Conversely, a break below 1.1510 would invalidate the bullish consolidation and open the door for a retest of 1.1500 and possibly 1.1490. Given the neutral-to-bearish bias in the short term, I favor selling on rallies to resistance levels while waiting for a clear breakout or breakdown before committing to a directional bias. Traders should watch for candlestick reversal patterns (like shooting stars or bearish engulfing) near 1.1550–1.1560 as potential entry signals for shorts, while monitoring 1.1510 as a key downside trigger.
* Phân tích thị trường được đăng ở đây nhằm mục đích nâng cao nhận thức của bạn, nhưng không đưa ra hướng dẫn để thực hiện giao dịch
 Tiếng Việt
 Русский
 English
 Bahasa Indonesia
 Bahasa Malay
 ไทย
ไทย Español
 Deutsch
 Български
 Français
 中文
中文 বাংলা
বাংলা हिन्दी
 Čeština
 Українська
 Română
