 Silver Price Forecast: XAG/USD Faces Bearish Pressure Below $64.62 as Momentum Weakens
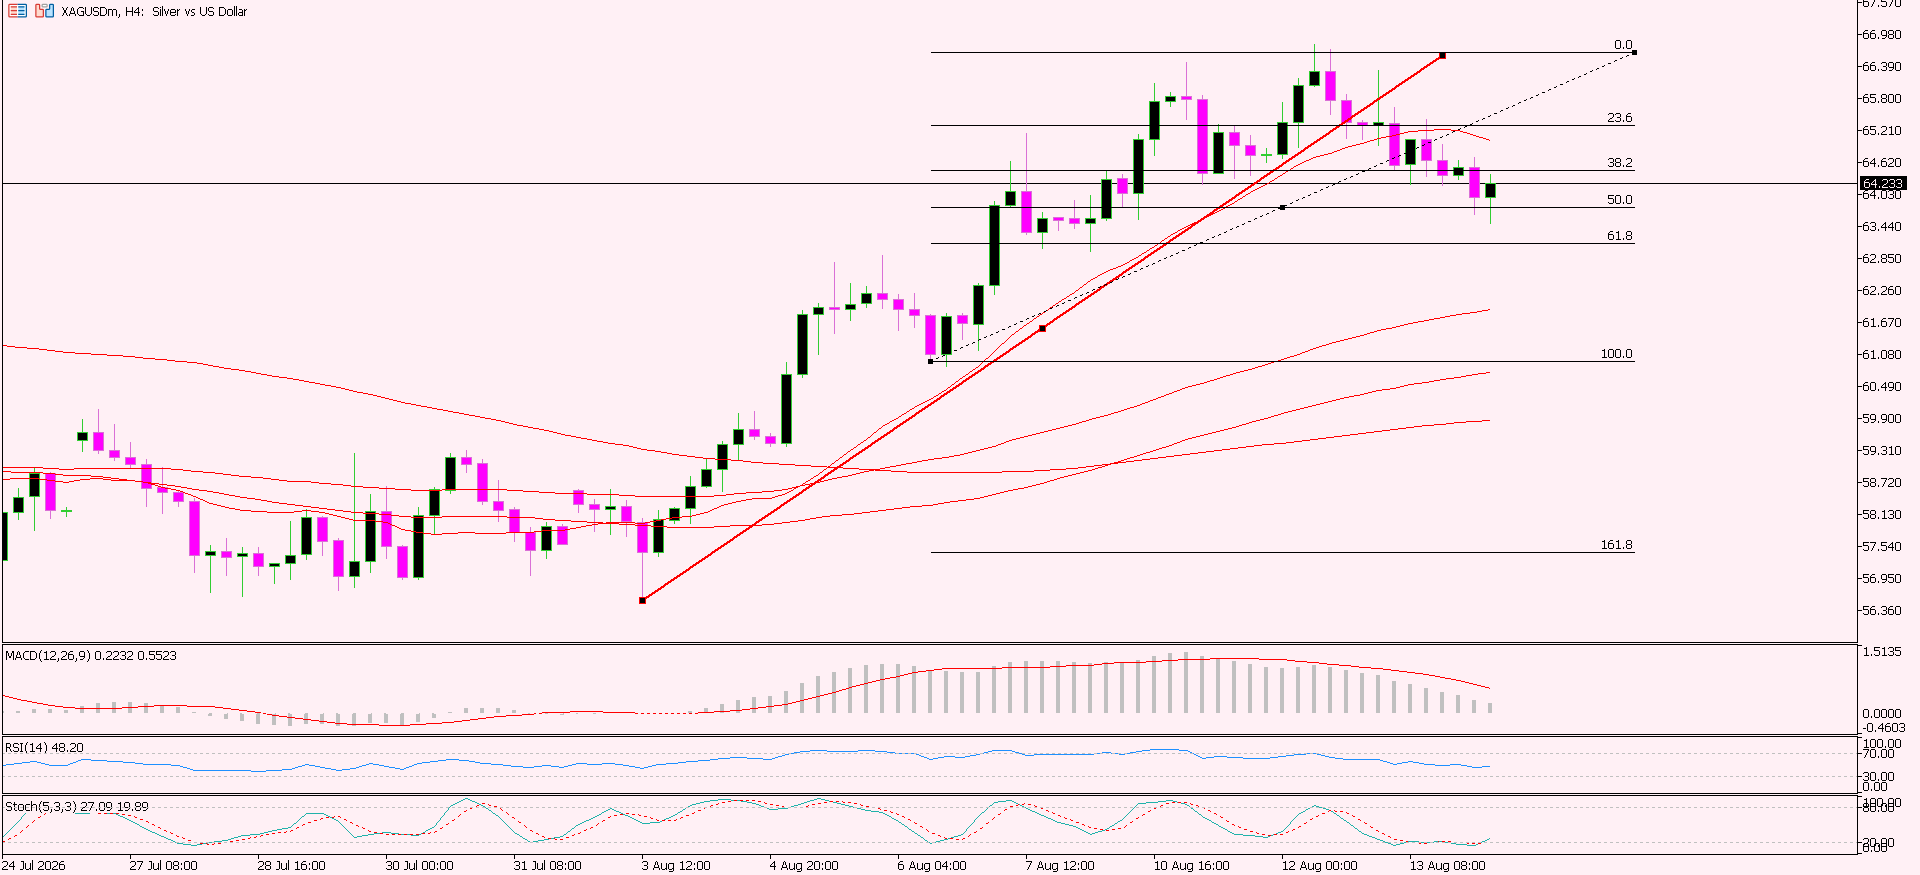
 Silver (XAG/USD) has posted losses for the second consecutive day today, and the price stands at $63.50 an ounce in Asia today. Silver is trading lower amid profit-taking ahead of the Fed’s future monetary policy outlook and ongoing tensions in the Middle East. Another factor that has impacted sentiment lately includes inflation figures in the country. According to the latest statistics from the Bureau of Labor Statistics, consumer prices remained unchanged in the month of July compared to the prior month’s 0.1% decline and expectations of a 0.2% gain. The core PPI grew by 0.2%, lower than expectations of a 0.3% growth. On a year-over-year basis, headline PPI increased 4.7%, while core PPI increased 4.2%. In the wake of the softened inflation numbers, expectations for the Federal Reserve interest rates have been revised by traders. According to the CME FedWatch Tool, the probabilities of a rate hike by the FOMC in September are reduced to 34.8%, from 40% recorded shortly following the release of PPI. On the other hand, efforts to reopen the Strait of Hormuz continue to be unsuccessful so far. Lack of progress continues to make investors wary of potential future tensions, leading to an increased price level and inflation. Technically, silver prices trade around $64.23 on the four-hour chart as they continue to fall further after falling from the $66.80 region. Despite being in an overall bullish formation, below the $57.00 support zone, current candles reveal weakening strength to the upside. Silver prices have fallen below the rising trendline and are currently approaching the 50% Fibonacci retracement of around $64.03. The Fibonacci formation presents critical technical levels as short-term resistance comes near the 38.2% retracement of $64.62, while the 23.6% comes near $65.21. Any price action above $65.21 will put sellers back in the driving seat and put them under pressure to test the $66.80 level. On the downside, a price breakdown below the $64.03 level may target the 61.8% Fibonacci retracement of around $63.44. Momentum oscillators look to be becoming weaker. The MACD histogram has dropped from the highest level seen, while the MACD oscillator itself is weakening within positive ground. This means that there has been a reduction in bullish momentum rather than a reconfirmation of further upside movement. RSI is seen trading at about 48.20 levels, which is not too far from 50. The stochastic oscillator is in the lower part of the oscillator, and the readings are seen at 27 and 19. What this means is that due to the selling momentum, it has moved towards the oversold territory, and this can give room for a bounce. The problem here is that being oversold is not enough for a reversal confirmation signal. To summarize, the 4H view has a bearish sentiment as long as price stays under $64.62. A breakdown from $64.03 would boost the bearish scenario and bring the price towards $63.44. The bullish move will be possible when prices stay above $64.03, aiming at $65.21 and $66.80 levels. Whether bulls will hold the 50% Fibonacci support level is the key question.
* Phân tích thị trường được đăng ở đây nhằm mục đích nâng cao nhận thức của bạn, nhưng không đưa ra hướng dẫn để thực hiện giao dịch
 Tiếng Việt
 Русский
 English
 Bahasa Indonesia
 Bahasa Malay
 ไทย
ไทย Español
 Deutsch
 Български
 Français
 中文
中文 বাংলা
বাংলা हिन्दी
 Čeština
 Українська
 Română
