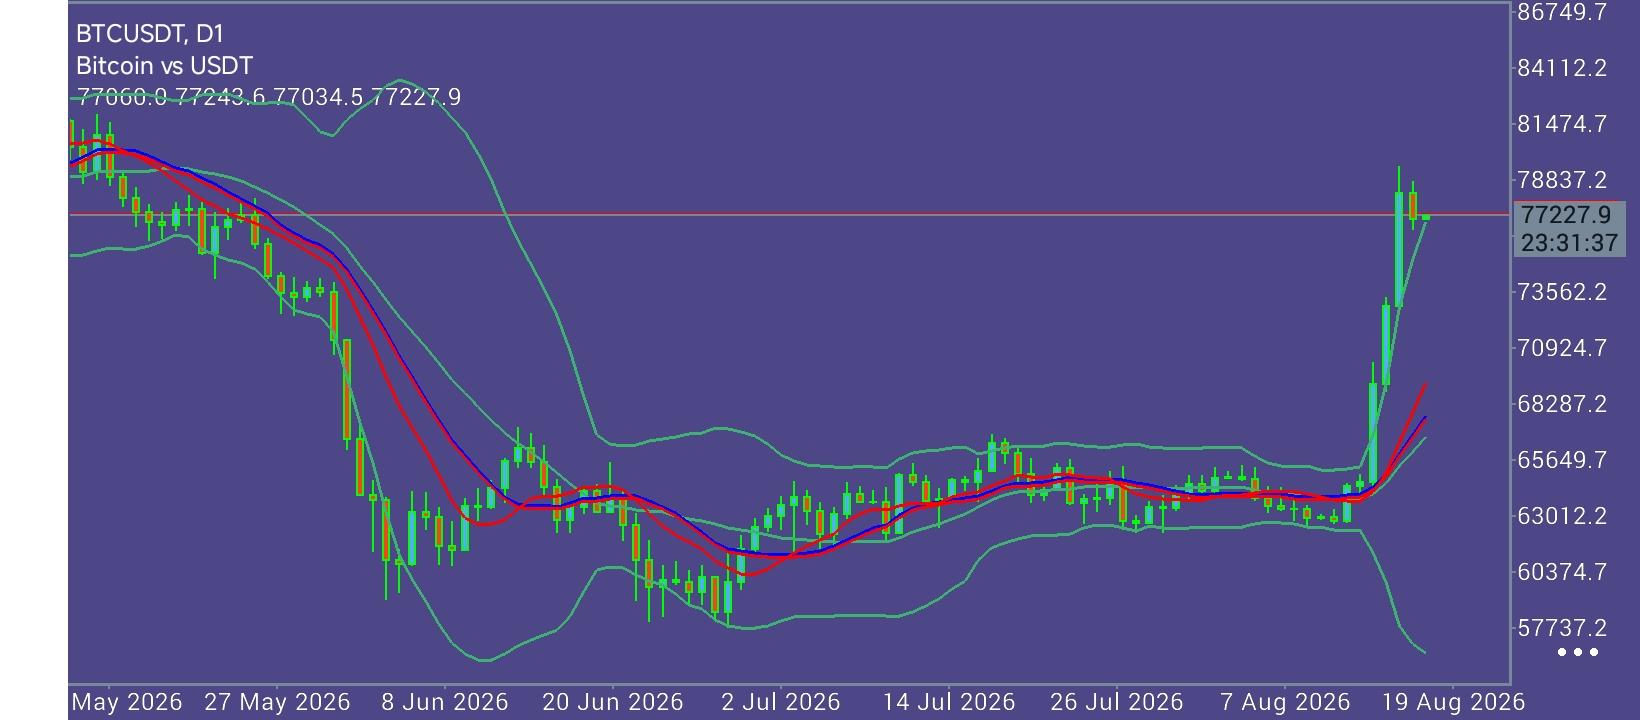
 The "78,490 Gateway": Liquidity Expansion and Short Squeeze Surge Bitcoin Past $77,000 Bitcoin (BTC)
 has expanded its upward trajectory, surging over
20% on the week to cross above the
$77,000.00 threshold and reach its highest valuation since mid-May. Global markets are responding aggressively to the U.S. Treasury’s decision to double its debt buyback operations for longer-dated securities from $2 billion to $4 billion per operation. This systemic liquidity injection ignited a massive short squeeze across crypto derivative markets, wiping out
$3.5 billion in leveraged positions within a 24-hour window—marking the seventh-largest liquidation event in cryptocurrency market history. Institutional appetite via U.S. spot ETFs has accelerated sharply alongside this rally, with capital inflows on pace to establish a new weekly high for the year. This institutional buying spree helped expand total cryptocurrency market capitalization by
$210 billion in a single week, bringing overall market valuation to
$2.45 trillion. From a technical perspective, Bitcoin has achieved a major structural milestone by vaulting above its
200-week Simple Moving Average (SMA) at $64,289.00 following months of mid-range consolidation. On the daily time frame, BTC maintains a pristine bullish configuration, trading comfortably above its exponential moving average cluster, anchored by the
200-day EMA near $71,532.00, the
100-day EMA at $66,784.00, and the
50-day EMA at $65,403.00. Momentum metrics remain forcefully positive: the weekly Relative Strength Index (RSI) has reclaimed the
56.00 level (crossing back into bullish territory for the first time since late 2025), while the daily RSI at
85.00 signals deeply overbought conditions. While overbought readings suggest near-term vulnerability to consolidation or mean-reversion toward the
$70,000.00 – $71,532.00 support band, weekly candle acceptance above the
61.8% Fibonacci retracement level at $78,490.00 remains the critical trigger to unlock upside expansion toward
$81,821.00.
Technical Trend Structure: The $71,532 "Demand Floor" and the $81,821 "Supply Citadel" The BTC/USD weekly and daily chart geometry exhibits a breakout structure above dynamic moving average baselines, backed by expanding volume.
The $81,821.00 "Supply Citadel": The primary overhead objective for Bitcoin bulls sits at
$81,821.00 (50-week SMA & Major Structural Barrier). A sustained weekly breakout above this dynamic moving average opens a technical runway toward secondary resistance levels at
$84,739.00.
The $78,490.00 "Pivot Node": The immediate structural threshold is the
$78,490.00 resistance level (61.8% Fibonacci Retracement of the August 2024 low to October 2025 high move). Securing a weekly close above this boundary confirms structural acceptance for the next leg higher.
The $71,532.00 "Support Floor": On the downside, primary dynamic support is anchored by the
200-day EMA at $71,532.00 and the
$70,000.00 psychological floor. A corrective breakdown below this zone exposes secondary support at the
100-day EMA ($66,784.00) and the
50-day EMA ($65,403.00).
Strategic Trading: Decision Nodes and Tactical Scenarios Navigating current BTC price action requires tracking confirmed weekly closes relative to key structural pivots.
Signal Type Entry Trigger Primary Target (TP) Protective Stop (SL) Tactical Rationale Bullish Breakout Weekly Close >
$78,490.00 $81,821.00 / $84,739.00 $74,800.00 Momentum continuation play on 61.8% Fibo clearance, ETF inflows, and macro liquidity expansion.
Bearish Rejection Daily Close <
$71,500.00 $66,784.00 / $65,403.00 $74,200.00 Fading overbought RSI conditions for a mean-reversion retest of underlying EMA dynamic floors.
Key Tactical Milestones: Immediate Resistance: The
$78,490.00 – $80,000.00 psychological range. A decisive breakout past this confluence confirms buyer dominance and opens the path toward major target zones.
Critical Support: The
$71,532.00 200-day EMA and the
$64,289.00 200-week SMA baseline. Holding price action above these moving averages preserves the macro bullish reversal. In summary, Bitcoin is trading with strong momentum near
$77,000.00. With macro Treasury buybacks fueling market liquidity and technical indicators supporting the multi-week reversal, the overall technical structure favors an eventual retest of
$81,821.00, provided the
$71,532.00 demand floor remains defended.
* Phân tích thị trường được đăng ở đây nhằm mục đích nâng cao nhận thức của bạn, nhưng không đưa ra hướng dẫn để thực hiện giao dịch
 Tiếng Việt
 Русский
 English
 Bahasa Indonesia
 Bahasa Malay
 ไทย
ไทย Español
 Deutsch
 Български
 Français
 中文
中文 বাংলা
বাংলা हिन्दी
 Čeština
 Українська
 Română
