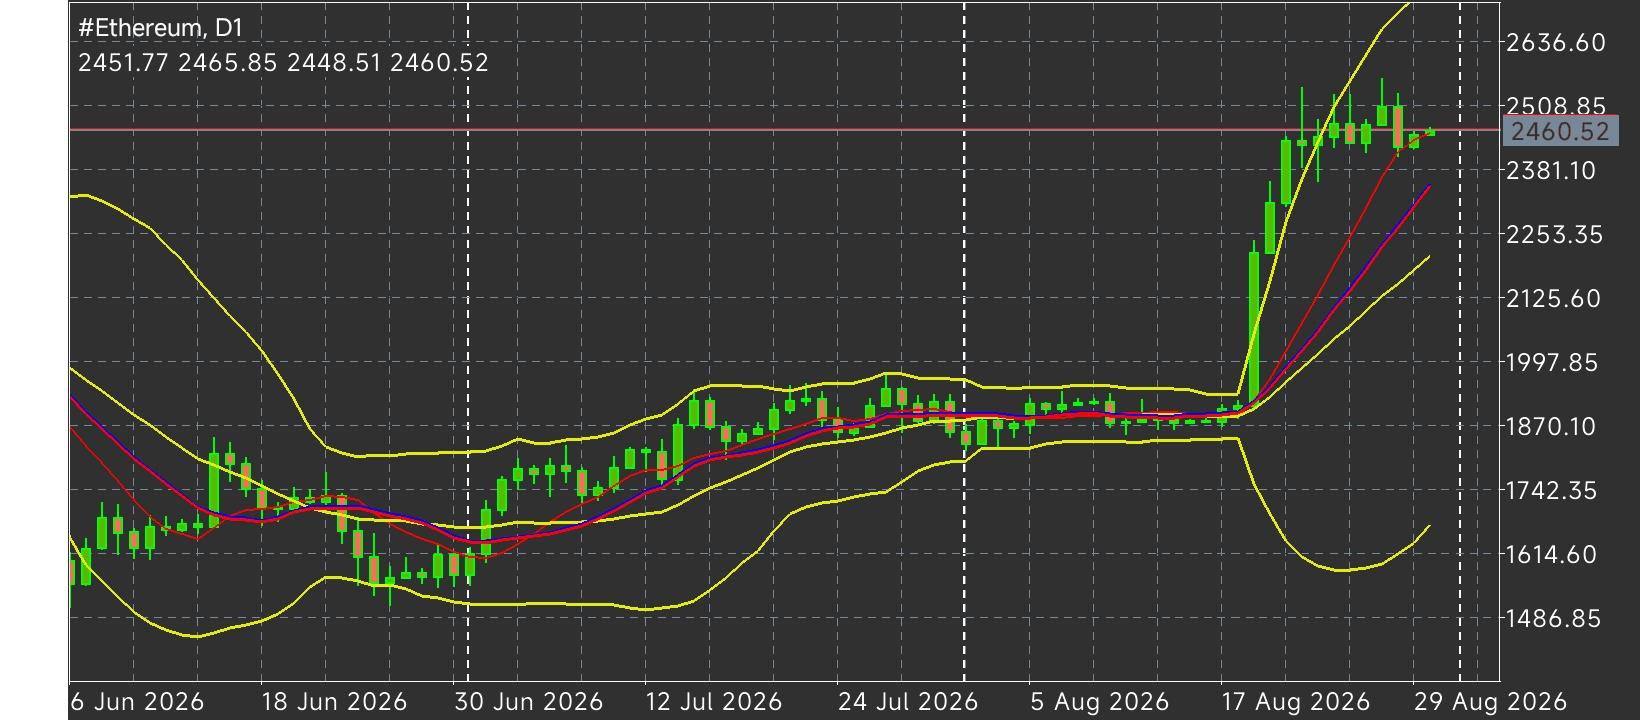
 Bullish Resilience Near $2,500: Ethereum Reclaims Cost Basis as Institutional ETF Inflows Surge Ethereum (ETH/USD)
 extended its upside consolidation near
$2,500.00 during recent trading sessions, holding firmly above the key
$2,400.00 pivot following an aggressive rally. However, upside momentum has shown signs of interim deceleration as market participants engage in targeted profit-taking. This shift coincides with ETH reclaiming its investors' average on-chain realized cost basis of
$2,306.00, effectively unlocking supply from holders who were previously underwater and seeking break-even or modest gains. On-chain profitability metrics confirm this behavior: Ethereum's Spent Output Profit Ratio (SOPR) has sustained a value above 1.0, indicating that moved coins are executing at a net profit, while exchange inflow volumes expanded around these cost-basis thresholds. Despite short-term profit realization, broader liquidity conditions remain highly supportive. Capital expansion within the stablecoin ecosystem injected over $4.1 billion in liquidity over the past two weeks, creating a deep bid under risk assets. Institutional participation has similarly intensified, with US Spot Ethereum ETFs recording $234.51 million in net daily inflows on Thursday to extend their positive streak to nine consecutive trading days. Weekly ETF inflows reached $722.24 million, representing the strongest single-week institutional commitment to Ethereum in nearly ten months. Conversely, derivatives market activity presents a cautious contrast: aggregate Open Interest (OI) has yet to recover meaningfully following recent leverage flushes, and subdued daily active addresses suggest underlying utility metrics have yet to fully confirm the latest price impulse.
On-Chain Realized Cost Basis & SOPR Mechanics: Crossing above the $2,306 investor cost basis unlocked profit-taking pressure, as evidenced by an elevated SOPR reading above 1.0. This supply absorption explains the current high-level consolidation near $2,500.
Macro Liquidity & ETF Inflow Surge: Institutional demand remains robust with nine consecutive days of spot ETF inflows ($722.24 million weekly total). Coupled with a $4.1 billion stablecoin market cap expansion, macro liquidity provides dynamic downside protection.
Derivatives & On-Chain Bottlenecks: A lack of aggressive long positioning in derivatives Open Interest, combined with recent long liquidations of $75.8 million (out of $97.3 million total), indicates that leveraged traders remain cautious, which may temper immediate breakout velocity. From an execution and chart structure perspective, key technical levels and target zones are mapped as follows:
Overhead Resistance Targets: Immediate horizontal resistance is capped at
$2,680.00. A confirmed daily close above this level would clear the path for an extended impulse move toward the major macro supply ceiling at
$2,879.00.
Key Support Boundaries: Immediate downside protection rests at the
$2,431.00 horizontal pivot. Below this structural floor, primary dynamic support is anchored by the 20-day EMA at
$2,261.00, followed by a dense long-term EMA cluster (50-day, 100-day, and 200-day EMAs) between
$2,073.00 and
$2,156.00. Deeper structural base levels reside at
$1,961.00,
$1,809.00, and
$1,701.00. The technical trend structure for ETH/USD remains constructively bullish across daily timeframes. While an elevated Stochastic Oscillator (81.00) and 14-day RSI (69.00) signal near-term overbought conditions, holding structural integrity above the
$2,431.00 support pivot and
$2,261.00 EMA floor keeps the primary path of least resistance directed toward
$2,680.00 and
$2,879.00.
* Phân tích thị trường được đăng ở đây nhằm mục đích nâng cao nhận thức của bạn, nhưng không đưa ra hướng dẫn để thực hiện giao dịch
 Tiếng Việt
 Русский
 English
 Bahasa Indonesia
 Bahasa Malay
 ไทย
ไทย Español
 Deutsch
 Български
 Français
 中文
中文 বাংলা
বাংলা हिन्दी
 Čeština
 Українська
 Română
