 GBP/USD Market Analysis (Daily Timeframe)
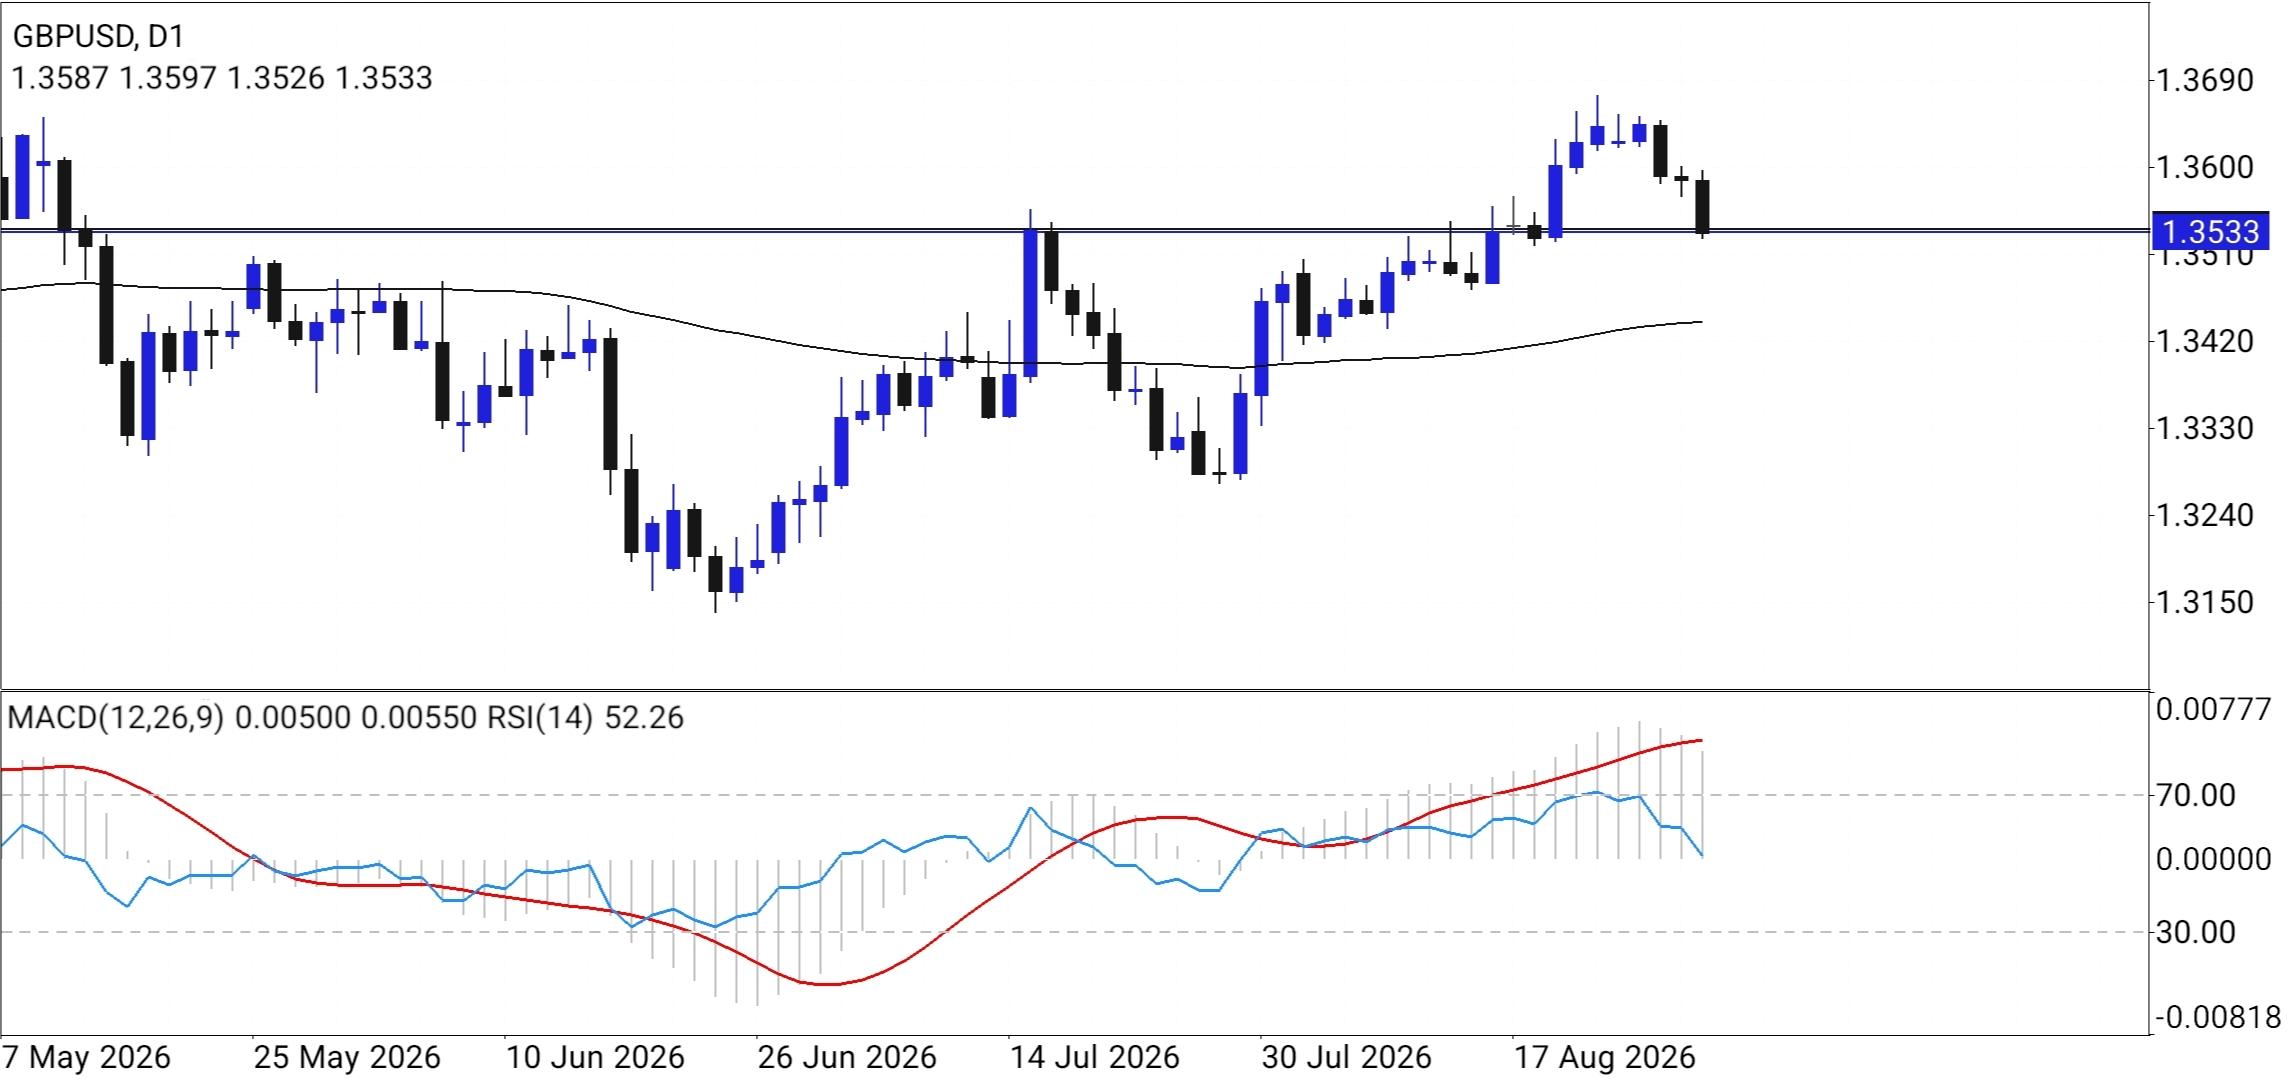
 The daily chart for GBP/USD shows a market in a phase of corrective pullbacks following an overall bullish swing. After printing a low near 1.3150 in late June, the pair initiated a strong upward rally, creating a series of higher highs and higher lows that capped near the 1.3650–1.3690 zone in mid-August. Currently, price action is undergoing a downward retracement, pulling back to test key structural support around 1.3533. This price area represents a crucial horizontal support-turned-resistance zone formed during mid-July, making it a key level for both bulls and bears. The daily candle is sitting right on top of this horizontal boundary.
From a technical perspective: • Moving Average: The price remains comfortably above the dynamic baseline (moving average), which is currently sloping upward near 1.3420. This indicates that the long-term trend favors buyers despite short-term selling pressure.
Momentum Indicators: • The RSI (14) sits neutral near 52.26, having cooled off from overbought territory during the mid-August peak, signaling balanced conditions without extreme momentum in either direction. • The MACD (12,26,9) shows the main MACD line starting to turn downward beneath the signal line while remaining above zero, indicating slowing upside momentum and ongoing corrective behavior. If buyers defend the key horizontal level at 1.3530, the pair could resume its macro uptrend toward previous peak resistance. Conversely, a decisive daily close below 1.3530 would likely extend the corrective phase down toward the moving average dynamic support around 1.3420.
Trade Setup • Bias: Bullish Continuation (Conditional on Support Hold) • Entry Zone: 1.3520 – 1.3540 • Stop Loss (SL): 1.3460 (Below immediate swing structure and safety margin) • Take Profit 1 (TP1): 1.3620 (Near recent swing highs) • Take Profit 2 (TP2): 1.3680 (Major resistance high) • Invalidation / Bearish Alternative: A daily close below 1.3500 invalidates the bullish setup, switching the short-term bias to short toward 1.3420.
* Phân tích thị trường được đăng ở đây nhằm mục đích nâng cao nhận thức của bạn, nhưng không đưa ra hướng dẫn để thực hiện giao dịch
 Tiếng Việt
 Русский
 English
 Bahasa Indonesia
 Bahasa Malay
 ไทย
ไทย Español
 Deutsch
 Български
 Français
 中文
中文 বাংলা
বাংলা हिन्दी
 Čeština
 Українська
 Română
