 Technical Analysis 14 October 2026 USD/JPY H-1
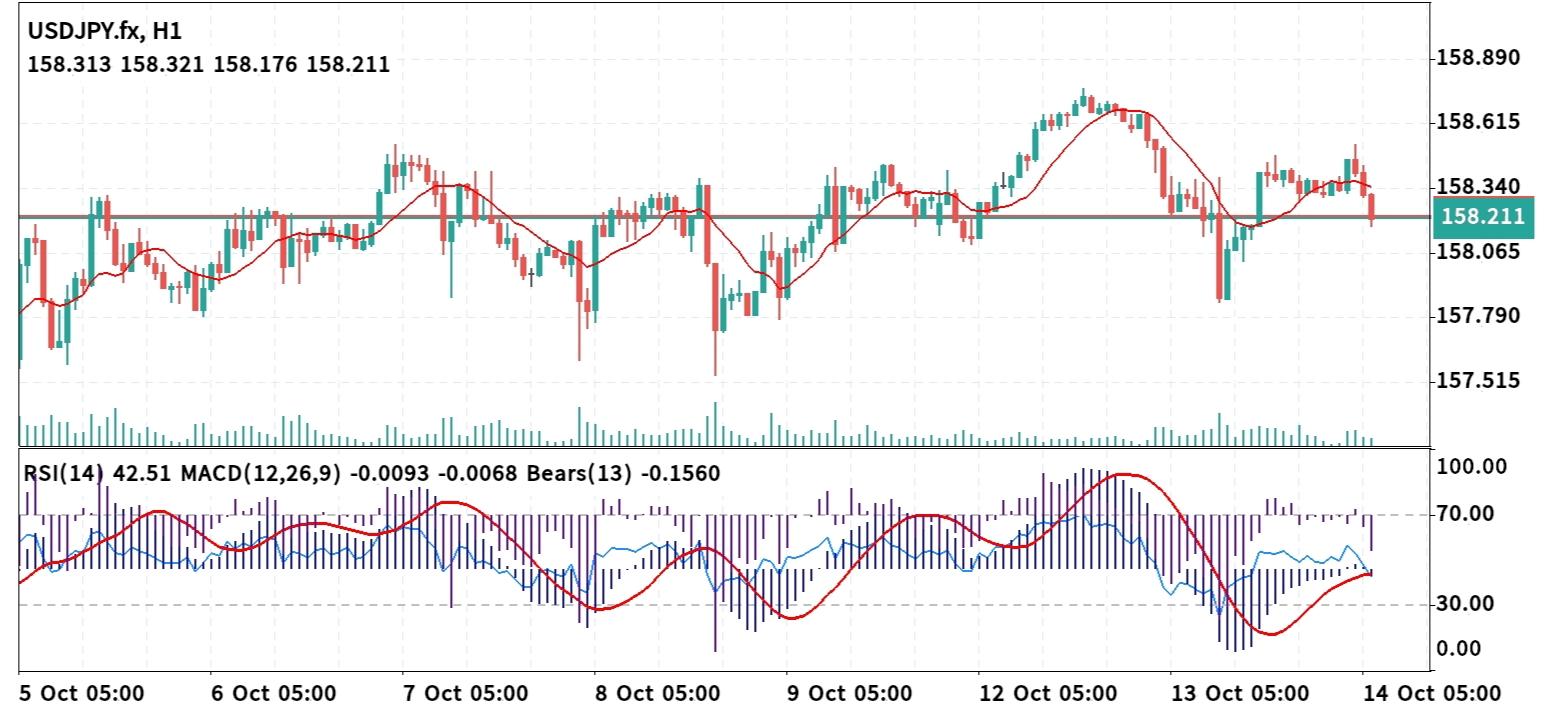
 The USD/JPY 1-hour chart shows price pulling back from its recent peak near 158.615 and pressing below its short-term moving average line. Price action is currently testing a major horizontal support level around 158.211, creating a pivotal moment for either a breakout extension or a supportive bounce. 1. Core Price Action & Structure * Current Price: 158.211 * Immediate Resistance Zone: 158.340 – 158.615 (Key overhead resistance levels marking the recent swing high and local supply zone). * Immediate Support Zone: 158.065 – 157.790 (Crucial demand floor where buyers previously stepped in during recent sharp pullbacks). * Moving Average Dynamic: Price has slipped slightly below its short-term moving average line, pointing to mild intraday selling pressure on the hourly chart. 2. Indicator Confluence * Relative Strength Index (RSI - 14): Currently sitting at 42.51. This indicates mild bearish momentum leaning below the neutral 50 level, but remains comfortably above oversold conditions. * MACD (12, 26, 9): Positioned at -0.0093 / -0.0068 below the signal line with minor negative histogram bars, reflecting weak downside momentum. * Bears Power (13): Reads -0.1560, confirming moderate seller involvement at current levels. 3. Strategic Entry Scenarios Scenario A: Bearish Breakdown (Short Entry) * Entry Trigger: A clean 1-hour candle close below 158.065 to confirm a breakdown beneath key horizontal support. * Stop Loss: 158.340 (placed safely above moving average resistance). * Take Profit Targets: * Target 1: 157.790 * Target 2: 157.515 Scenario B: Bullish Reversal (Long Entry) * Entry Trigger: A strong 1-hour reversal candle closing back above 158.340, signaling a successful support bounce and recovery above the moving average. * Stop Loss: 158.065 (placed below immediate support). * Take Profit Targets: * Target 1: 158.615 * Target 2: 158.890 Risk Management Note Trading directly at the 158.211 horizontal level carries range-bound consolidation risk. Conservative traders should wait for a confirmed hourly candle close beyond 158.065 or 158.340 before taking positions. Always adhere to a strict risk-to-reward ratio of at least 1:2.
* Phân tích thị trường được đăng ở đây nhằm mục đích nâng cao nhận thức của bạn, nhưng không đưa ra hướng dẫn để thực hiện giao dịch
 Tiếng Việt
 Русский
 English
 Bahasa Indonesia
 Bahasa Malay
 ไทย
ไทย Español
 Deutsch
 Български
 Français
 中文
中文 বাংলা
বাংলা हिन्दी
 Čeština
 Українська
 Română
