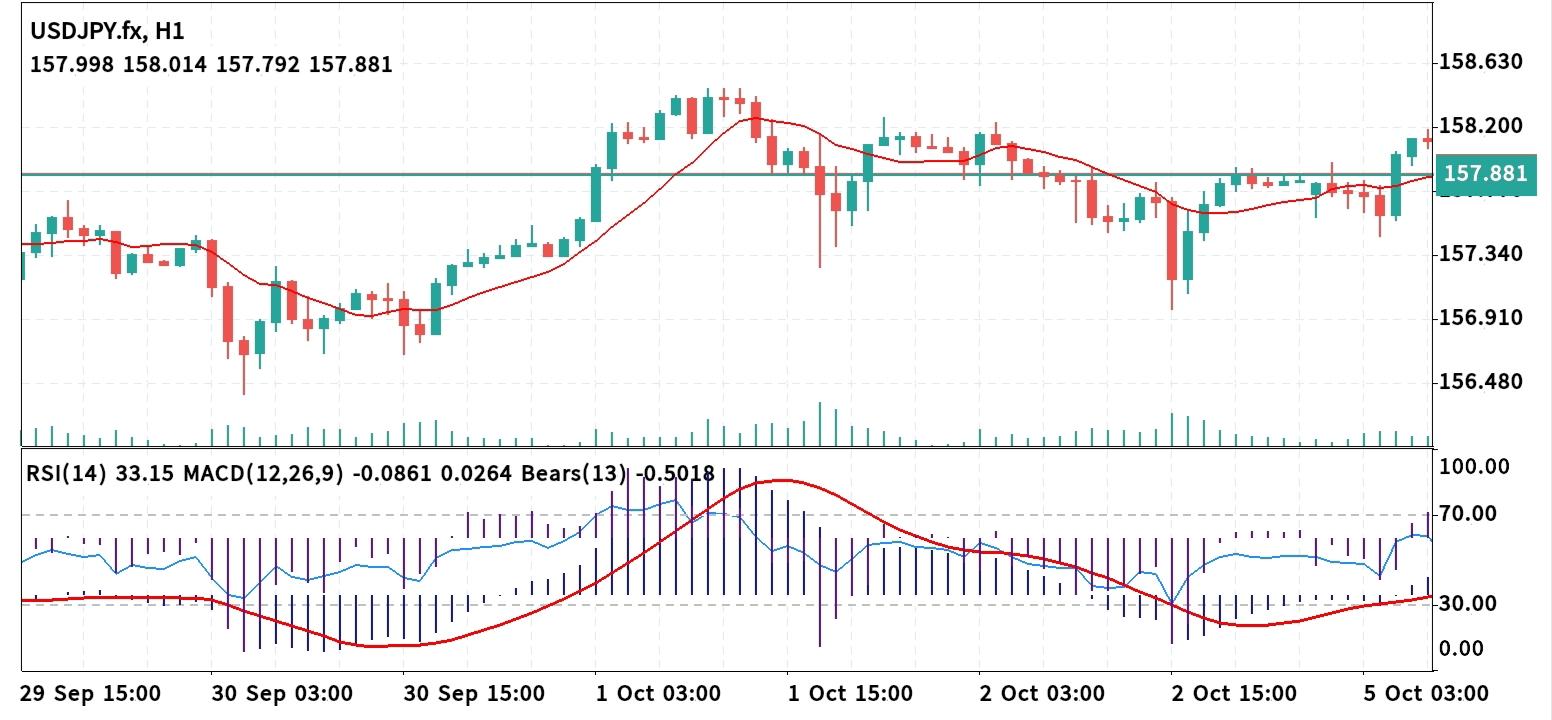
 Technical Analysis 15 October 2026 USD/JPY H-1
 The USD/JPY 1-hour chart shows price making a bullish push off recent consolidation support, crossing cleanly above both its short-term moving average line and key horizontal pivot near 157.881. Price action is attempting to establish upward momentum toward higher resistance targets. 1. Core Price Action & Structure * Current Price: 157.881 * Immediate Resistance Zone: 158.200 – 158.630 (Major overhead supply area corresponding to recent peak highs). * Immediate Support Zone: 157.340 – 156.910 (Crucial demand region where recent bullish reversal wicks formed). * Moving Average Dynamic: Price has pushed above its short-term moving average line, establishing immediate dynamic support on the 1-hour timeframe. 2. Indicator Confluence * Relative Strength Index (RSI - 14): Currently sitting at 33.15. While lingering near lower levels following the previous downswing, the upward trajectory of price suggests early stages of momentum recovery out of near-oversold bounds. * MACD (12, 26, 9): Positioned at -0.0861 / 0.0264. Histogram bars are beginning to flatten near zero, indicating selling momentum is diminishing as buyers step back in. * Bears Power (13): Reads -0.5018, reflecting declining bearish influence as bulls regain short-term control. 3. Strategic Entry Scenarios Scenario A: Bullish Continuation (Long Entry) * Entry Trigger: A sustained 1-hour candle close above 157.900 or a minor pull-back retest toward 157.800 near moving average support. * Stop Loss: 157.340 (placed safely below immediate support and moving average). * Take Profit Targets: * Target 1: 158.200 * Target 2: 158.630 Scenario B: Bearish Rejection (Short Entry) * Entry Trigger: A 1-hour candle closing firmly back below 157.340, signaling a false breakout and breakdown under support. * Stop Loss: 157.900 (above recent breakout consolidation level). * Take Profit Targets: * Target 1: 156.910 * Target 2: 156.480 Risk Management Note While current price action shows bullish breakout characteristics above 157.881, the overall indicator values warrant caution. Ensure confirmation via full 1-hour candle closes above 157.900 before executing orders to avoid false breakouts. Always maintain a risk-to-reward ratio of at least 1:2.
* Phân tích thị trường được đăng ở đây nhằm mục đích nâng cao nhận thức của bạn, nhưng không đưa ra hướng dẫn để thực hiện giao dịch
 Tiếng Việt
 Русский
 English
 Bahasa Indonesia
 Bahasa Malay
 ไทย
ไทย Español
 Deutsch
 Български
 Français
 中文
中文 বাংলা
বাংলা हिन्दी
 Čeština
 Українська
 Română
