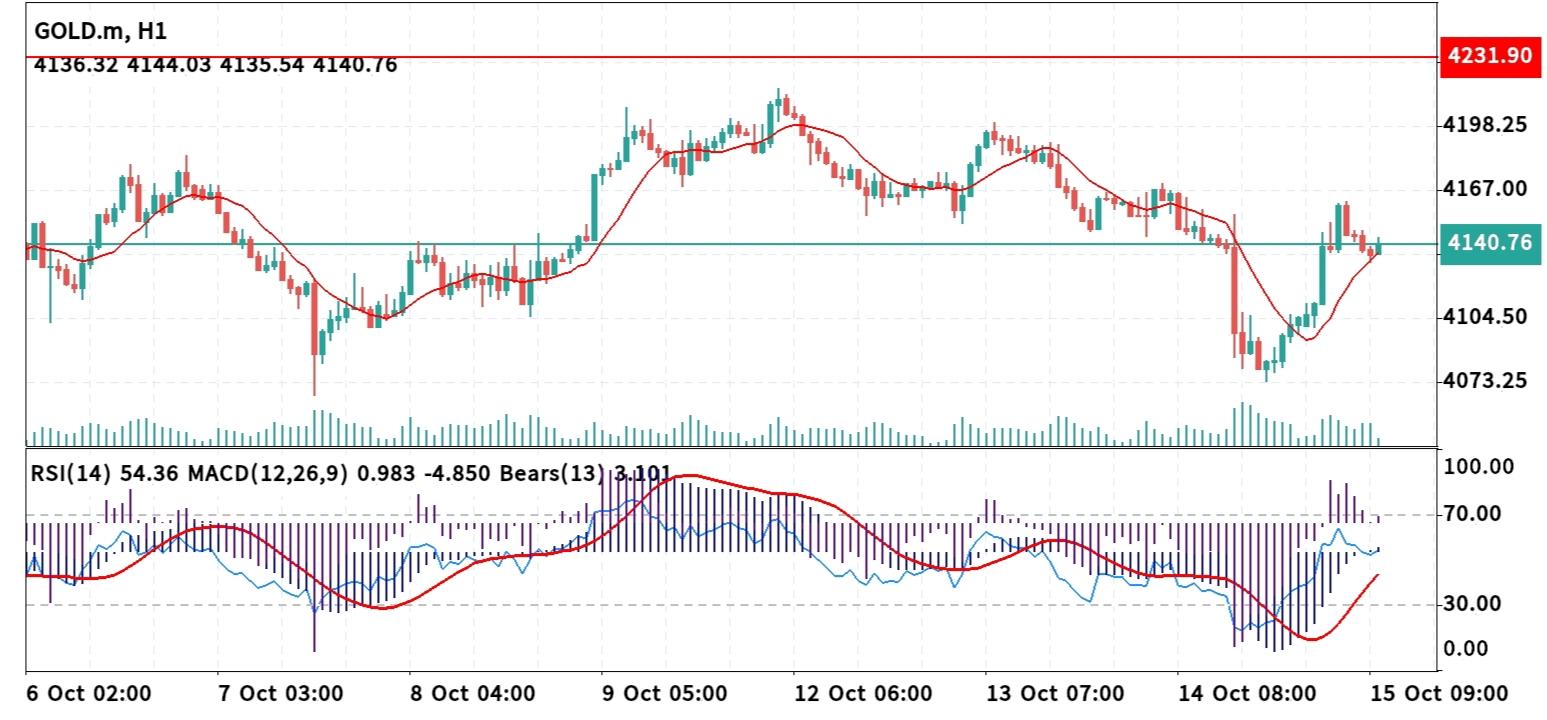
 Technical Analysis 15 October 2026 Gold H-1
 The Gold (GOLD) 1-hour chart demonstrates a strong V-shaped recovery following a sharp drop to local lows around 4073.25. Price action has successfully reclaimed its position above the short-term moving average line and is currently consolidating around a key central horizontal pivot near 4140.76. 1. Core Price Action & Structure * Current Price: 4140.76 * Immediate Resistance Zone: 4167.00 – 4198.25 (Key supply region where previous rallies encountered selling pressure prior to the recent sell-off). * Immediate Support Zone: 4104.50 – 4073.25 (Crucial demand floor where recent aggressive bullish reversal wicks originated). * Moving Average Dynamic: Price has pushed back above its short-term moving average line, turning the dynamic trend supportive on the 1-hour timeframe. 2. Indicator Confluence * Relative Strength Index (RSI - 14): Currently sitting at 54.36. This reflects healthy bullish momentum holding above the neutral 50 line, with significant upside room before entering overbought territory. * MACD (12, 26, 9): Positioned at 0.983 / -4.850. The main line has crossed into positive territory with shrinking negative signal distance, confirming strong recovery momentum following the recent bottom. * Bears Power (13): Reads 3.101, demonstrating that buyers have regained full operational control over selling forces. 3. Strategic Entry Scenarios Scenario A: Bullish Continuation (Long Entry) * Entry Trigger: A sustained 1-hour candle close above 4144.00 or a shallow retest to 4120.00 near moving average support. * Stop Loss: 4104.50 (placed safely below moving average support and minor swing lows). * Take Profit Targets: * Target 1: 4167.00 * Target 2: 4198.25 Scenario B: Bearish Rejection (Short Entry) * Entry Trigger: A 1-hour candle closing back below 4104.50, confirming a false recovery and breakdown under dynamic support. * Stop Loss: 4144.00 (above recent consolidation high). * Take Profit Targets: * Target 1: 4073.25 * Target 2: 4050.00 Risk Management Note While RSI and Bears Power signal bullish control above 4140.76, trading near the central horizontal line carries temporary consolidation risk. Conservative traders should wait for a confirmed hourly candle close above 4144.00 or a verified pullback to secure high-probability trade setups. Always maintain a risk-to-reward ratio of at least 1:2. Would you like to analyze another chart or refine specific risk levels for this Gold trade setup?
* Phân tích thị trường được đăng ở đây nhằm mục đích nâng cao nhận thức của bạn, nhưng không đưa ra hướng dẫn để thực hiện giao dịch
 Tiếng Việt
 Русский
 English
 Bahasa Indonesia
 Bahasa Malay
 ไทย
ไทย Español
 Deutsch
 Български
 Français
 中文
中文 বাংলা
বাংলা हिन्दी
 Čeština
 Українська
 Română
