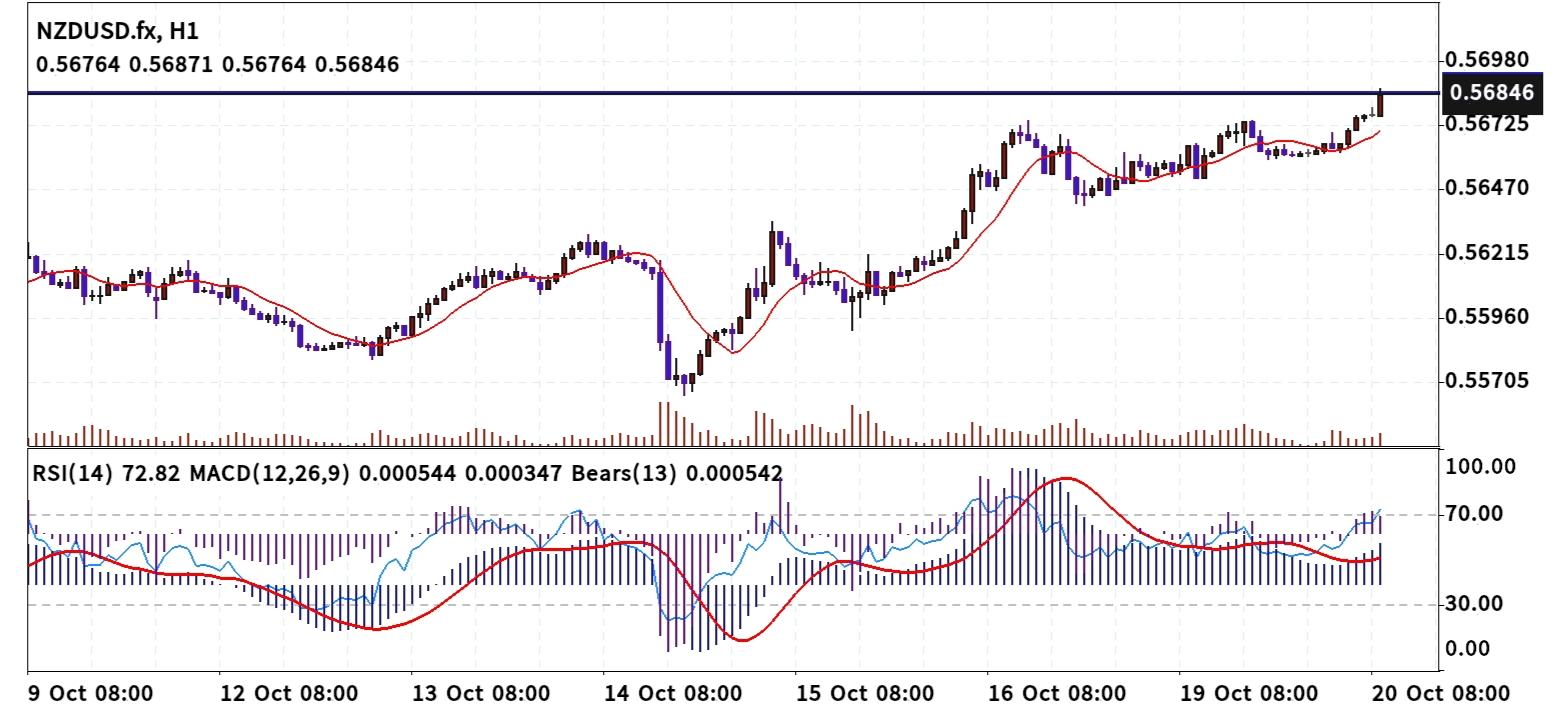
 Technical Analysis 20 October 2026 NZD/USD H-1
The NZD/USD 1-hour chart displays a strong bullish expansion phase following a steady accumulation pattern off earlier swing lows near 0.55705. Price action has aggressively pushed above its upward-sloping short-term moving average line and is currently testing a high-confluence horizontal resistance ceiling at 0.56846. This crucial retest of overhead supply creates well-defined breakout and pullback execution scenarios. 1. Core Price Action & Structure * Current Price: 0.56846 * Immediate Resistance Zone: 0.56846 – 0.56980 (Major overhead supply area corresponding to multi-session peak highs where selling pressure previously initiated). * Immediate Support Zone: 0.56725 – 0.56470 (Key intraday demand zone supported by the upward-sloping short-term moving average line and prior consolidation floors). * Moving Average Dynamic: Price is holding comfortably above its rising short-term moving average line, establishing strong dynamic trend support on the 1-hour timeframe. 2. Indicator Confluence * Relative Strength Index (RSI - 14): Currently sitting at 72.82. This places momentum firmly in overbought territory above the 70 threshold, signaling powerful buying pressure while cautioning against chasing late long entries. * MACD (12, 26, 9): Positioned at 0.000544 / 0.000347 above the zero baseline. The main line is expanding cleanly above its signal line with rising histogram bars, confirming strong bullish momentum acceleration. * Bears Power (13): Reads 0.000542, demonstrating that bulls maintain absolute market dominance over selling forces during current sessions. 3. Strategic Entry Scenarios Scenario A: Bullish Breakout (Long Entry) * Entry Trigger: A sustained 1-hour candle close above 0.56870 to confirm a resistance breakout, or a shallow dip-buy retest near 0.56725 at dynamic moving average support. * Stop Loss: 0.56470 (placed safely below immediate dynamic support and structural consolidation floors). * Take Profit Targets: * Target 1: 0.56980 * Target 2: 0.57250 Scenario B: Bearish Rejection (Short Entry) * Entry Trigger: A clean 1-hour bearish rejection candle at overhead resistance followed by a confirmed close below 0.56725. * Stop Loss: 0.56980 (placed safely above immediate resistance peak wicks). * Take Profit Targets: * Target 1: 0.56470 * Target 2: 0.56215 4. Executive Summary The NZD/USD 1-hour chart displays a robust bullish trend posture as price advances aggressively from its structural low at 0.55705 to challenge primary resistance at 0.56846. Technical indicators strongly favor buyers, highlighted by a positive MACD expansion above zero (0.000544 / 0.000347) and positive Bears Power at 0.000542. However, because the 14-period RSI is currently reading 72.82 in overbought territory directly beneath overhead horizontal resistance at 0.56846, executing market long orders immediately carries short-term pull-back risk. High-probability trade execution will depend on patient confirmation: traders should look for either a verified 1-hour candle close above 0.56870 to target a move toward 0.56980, or a disciplined pullback retest near 0.56725 to enter with superior risk-reward parameters. Always enforce strict risk management and maintain a minimum 1:2 risk-to-reward ratio across all trade setups.
* Phân tích thị trường được đăng ở đây nhằm mục đích nâng cao nhận thức của bạn, nhưng không đưa ra hướng dẫn để thực hiện giao dịch
 Tiếng Việt

 Русский
 English
 Bahasa Indonesia
 Bahasa Malay
 ไทย
 Español
 Deutsch
 Български
 Français
 中文
 বাংলা
 हिन्दी
 Čeština
 Українська
 Română

