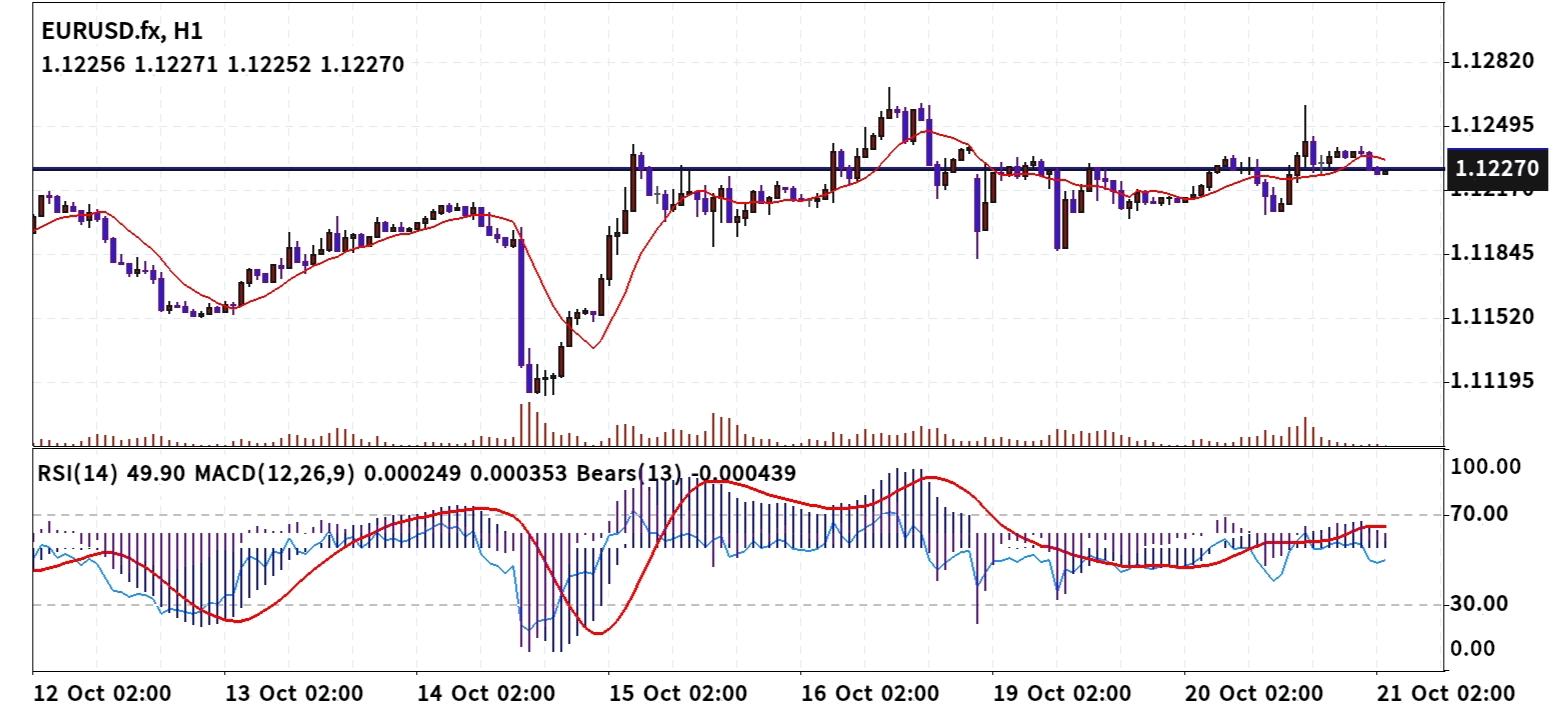
 Technical Analysis 21 October 2026 EUR/USD H-1
The EUR/USD 1-hour chart displays a tight horizontal consolidation phase following a minor pull-back from multi-session swing highs near 1.12495. Price action is currently compressing directly along a key horizontal baseline support pivot at 1.12270, interacting closely with its short-term moving average line. This structural compression sets up clear technical execution levels for both breakout buyers and breakdown sellers. 1. Core Price Action & Structure * Current Price: 1.12270 * Immediate Resistance Zone: 1.12495 – 1.12820 (Major overhead supply area corresponding to multi-session peak highs where selling pressure previously initiated). * Immediate Support Zone: 1.12170 – 1.11845 (Crucial demand region supported by prior structural consolidation floors and dynamic moving average levels). * Moving Average Dynamic: Price is oscillating tightly around its short-term moving average line at 1.12270, signaling temporary price equilibrium and minor sideways chop. 2. Indicator Confluence * Relative Strength Index (RSI - 14): Currently sitting at 49.90. This places momentum virtually dead-center at the neutral 50 threshold, reflecting balanced market sentiment prior to a directional breakout. * MACD (12, 26, 9): Positioned at 0.000249 / 0.000353 above the zero baseline. While holding in positive territory, the signal line is flattening with shrinking histogram bars, confirming range-bound consolidation. * Bears Power (13): Reads -0.000439, indicating minor seller influence that currently lacks the momentum required to spark a decisive breakdown. 3. Strategic Entry Scenarios Scenario A: Bullish Continuation (Long Entry) * Entry Trigger: A sustained 1-hour candle close above 1.12350 to confirm a bounce off horizontal baseline support, or a shallow dip-buy retest near 1.12170. * Stop Loss: 1.11845 (placed safely below immediate dynamic support and structural consolidation floors). * Take Profit Targets: * Target 1: 1.12495 * Target 2: 1.12820 Scenario B: Bearish Breakdown (Short Entry) * Entry Trigger: A clean 1-hour candle close below 1.12170, confirming support failure and a breakdown beneath dynamic moving average levels. * Stop Loss: 1.12350 (placed safely above immediate consolidation resistance). * Take Profit Targets: * Target 1: 1.11845 * Target 2: 1.11520 4. Executive Summary The EUR/USD 1-hour chart displays a neutral, range-bound market posture as price compresses directly along the 1.12270 horizontal baseline. Technical indicators confirm temporary market indecision: the 14-period RSI sits right at 49.90, while the MACD baseline (0.000249 / 0.000353) and Bears Power (-0.000439) show low directional intensity. Because price action is tightly bound between dynamic support near 1.12170 and resistance near 1.12495, taking market orders directly inside this immediate compression zone carries short-term chop risk. High-probability trade execution will depend on patient confirmation: traders should look for either a verified 1-hour candle close above 1.12350 to target a retest of overhead resistance at 1.12495, or a breakdown close below 1.12170 to catch a deeper slide toward 1.11845. Always enforce strict risk management rules and maintain a minimum 1:2 risk-to-reward ratio across all trade executions.
* Phân tích thị trường được đăng ở đây nhằm mục đích nâng cao nhận thức của bạn, nhưng không đưa ra hướng dẫn để thực hiện giao dịch
 Tiếng Việt

 Русский
 English
 Bahasa Indonesia
 Bahasa Malay
 ไทย
 Español
 Deutsch
 Български
 Français
 中文
 বাংলা
 हिन्दी
 Čeština
 Українська
 Română

