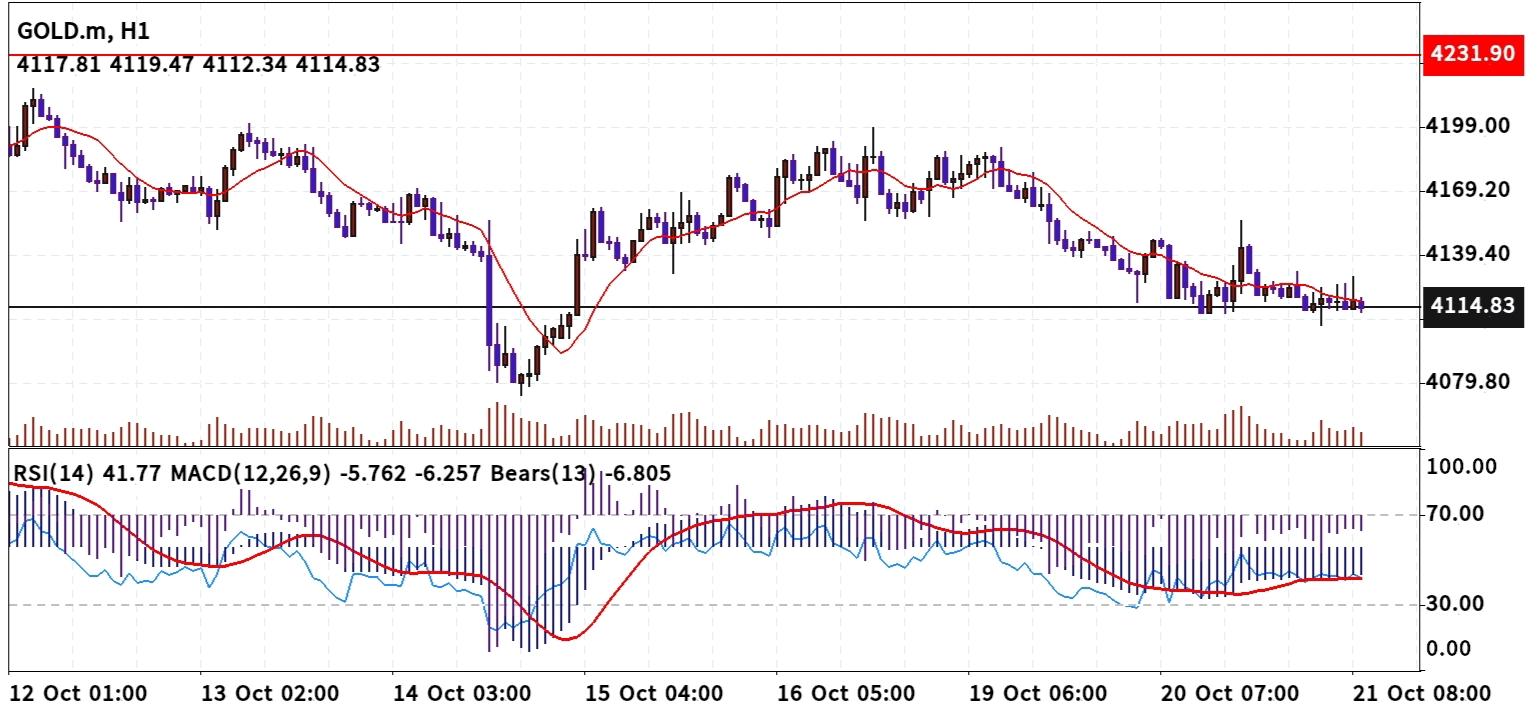
 Technical Analysis 21 October 2026 Gold H-1
The Gold (GOLD.m) market on the 1-hour timeframe is currently exhibiting a corrective, range-bound consolidation phase near the 4114.83 price handle. Following a sharp mid-October sell-off from highs approaching 4231.90, bullion prices have stabilized into a tight horizontal range. Price action is currently hovering right below the short-term moving average, reflecting cautious sentiment from both buyers and sellers as the market searches for a definitive directional catalyst. Technical Analysis & Key Levels * Moving Average (EMA): The price is testing the descending short-term exponential moving average, which continues to act as a dynamic overhead barrier for any short-term relief rallies. * Relative Strength Index (RSI 14): Registered at 41.77, indicating weak bearish momentum that is lingering just below the neutral 50 threshold without reaching oversold depths. * MACD (12,26,9) & Bears Power: The MACD lines display negative values (-5.762 and -6.257), reflecting ongoing structural weakness. Meanwhile, the Bears Power indicator reads -6.805, pointing to persistent underlying selling pressure on hourly timeframes. Key Support & Resistance Levels * Resistance 2 (R2): 4231.90 (Major swing high ceiling) * Resistance 1 (R1): 4169.20 – 4199.00 (Immediate overhead resistance zone) * Support 1 (S1): 4112.34 – 4114.83 (Current consolidation floor and immediate support) * Support 2 (S2): 4079.80 (Secondary downside structural support target) * Major Base Support: 4030.00 (Recent low pivot base) Trading Hints & Strategy Scenarios Scenario A: Short-Term Breakout / Relief Bounce (Buy Setup) * Entry: Buy stop on a confirmed H1 candle close above 4139.40. * Take Profit (TP): 4169.20 / 4199.00 * Stop Loss (SL): 4105.00 (Tight risk control below current consolidation range) * Rationale: If buyers manage to defend the 4112.34 support zone and clear local horizontal hurdles, a mean-reversion bounce toward the 4169.20 resistance becomes probable. Scenario B: Downside Breakdown (Sell Setup) * Entry: Sell stop on a clean hourly close below 4110.00. * Take Profit (TP): 4079.80 * Stop Loss (SL): 4142.00 (Above immediate moving average resistance) * Rationale: Given negative MACD values and negative Bears Power readings, a breakdown below the 4112.34 floor will likely trigger accelerated long liquidation toward 4079.80. Executive Summary Gold (GOLD.m) on the 1-hour chart remains subdued under a broader corrective bias following its drop from the 4231.90 peak. With the RSI hovering at 41.77 and negative MACD/Bears Power values signaling persistent caution, market participants should closely monitor price reactions around the 4114.83 pivot level. Traders should wait for a confirmed break outside the immediate 4112.34 – 4139.40 range before committing major capital. Implementing strict risk management rules and utilizing proper stop losses is crucial given gold's sensitivity to sudden macroeconomic updates.
* Phân tích thị trường được đăng ở đây nhằm mục đích nâng cao nhận thức của bạn, nhưng không đưa ra hướng dẫn để thực hiện giao dịch
 Tiếng Việt

 Русский
 English
 Bahasa Indonesia
 Bahasa Malay
 ไทย
 Español
 Deutsch
 Български
 Français
 中文
 বাংলা
 हिन्दी
 Čeština
 Українська
 Română

