 Silver Daily Forecast
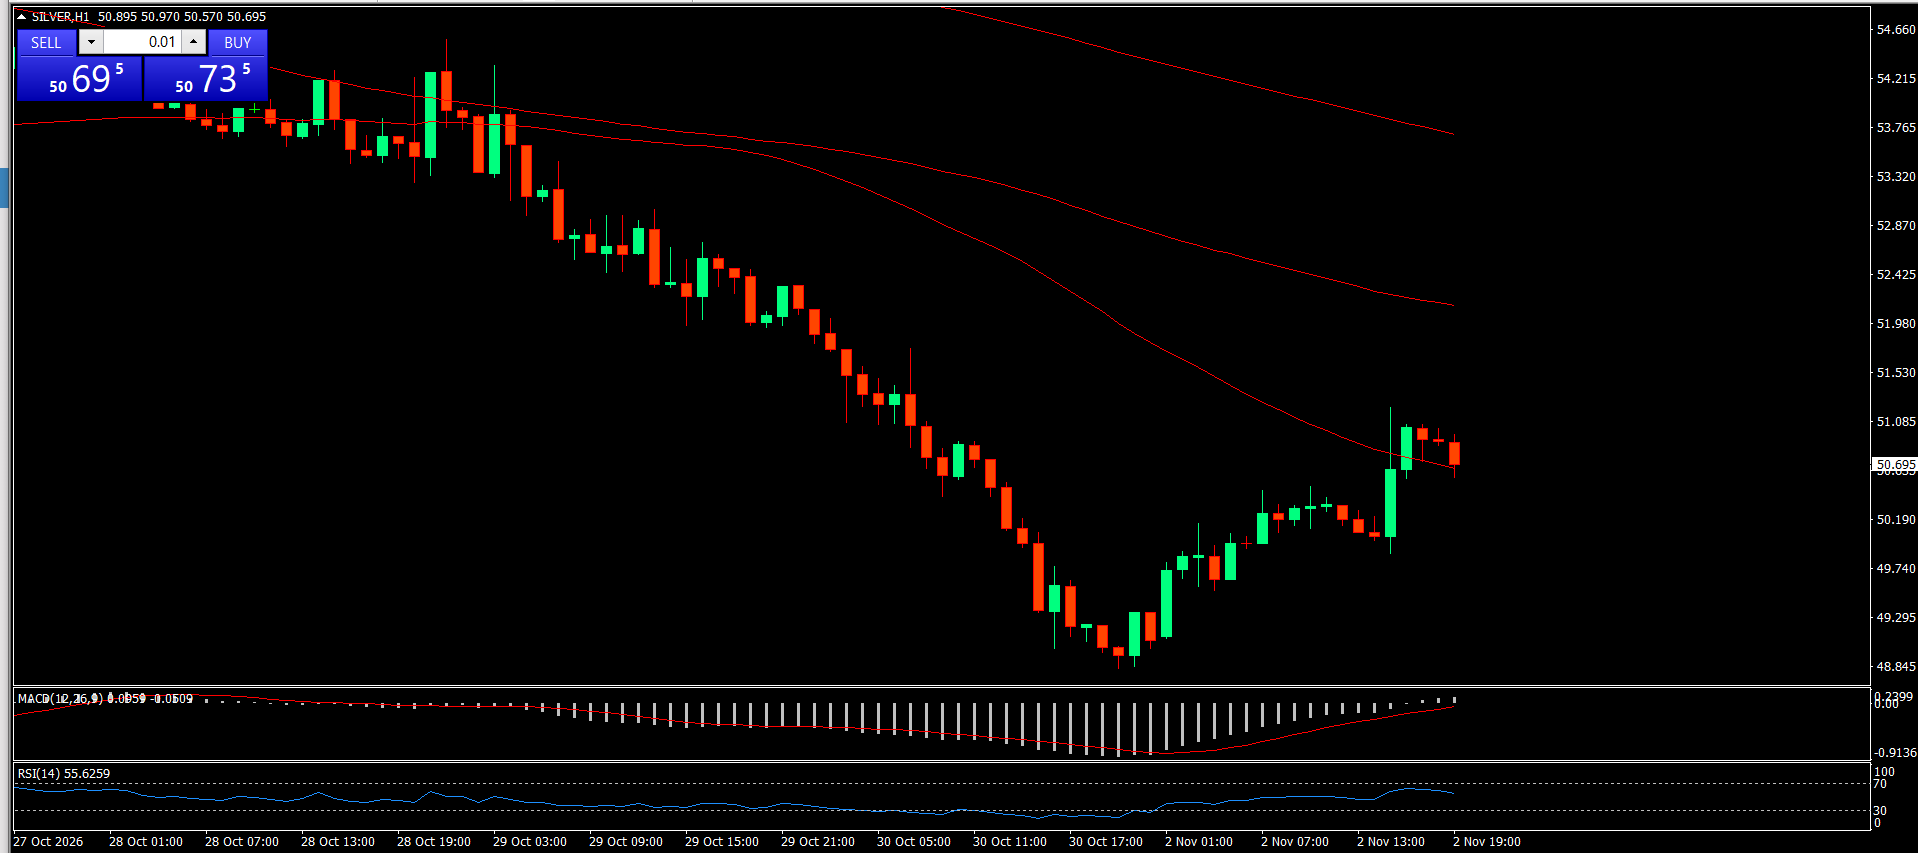
Silver (XAG/USD) is trying to make a comeback after dropping to an all-time low of $48.47 on Friday. This move follows sharp declines in crude oil prices, down more than 5% amid encouraging diplomatic developments between the United States and Iran. As of this writing, XAG/USD trades around $50.71, up 3.30%. Iranian President Masoud Pezeshkian said Iran's Supreme Leader authorised the government to proceed with talks. According to ISNA, prior reports indicated President Donald Trump supports extending diplomatic discussions with Iran. Lowering crude oil prices eases inflation risk and allows US Treasury bond yields to continue trending lower after the technology stocks' selloff, putting downward pressure on the US Dollar (USD). In turn, this move supports a bounce-back in silver prices. However, a continued downtrend in crude oil prices is not certain, as negotiations between both sides remain unclear, leaving military actions open-ended. This means silver prices' upside depends on whether negotiations sustainably reduce crude oil prices. Otherwise, higher energy costs may persist, keeping inflation risk on track. In this scenario, the Fed stays hawkish. Higher interest rates raise the cost of carrying non-yielding silver. On the daily chart, silver is currently trading below the 21-day SMA of $56, the 100-day SMA of $61, and the 200-day SMA of $70. This positioning suggests the precious metal is in a correction phase, as the price moves below all trend filters on the technical analysis screen. At the same time, the Relative Strength Index (RSI) currently hovers near 31 before falling into the oversold region. MACD indicators remain in negative territory with low momentum, while ADX lines trend higher at 42. These figures suggest the existing downtrend in the XAG/USD currency pair remains dominant despite approaching the oversold zone. At the buyers' point of interest, initial resistance appears at $52, followed by stronger resistance at $55. Indeed, the current 21-day SMA level stands at $56. It offers strong resistance at $61, where the 100-day SMA comes into play. The next recovery level is $67, the previous range ceiling, followed by the 200-day SMA resistance barrier at $70. For bearish targets, first support lies near Friday's swing low at $48.87. Any move below this support will likely trigger a stronger recovery in XAG/USD. Note that the current daily RSI is below 40, while the ADX gauge has strengthened into the 30-level territory.
* Phân tích thị trường được đăng ở đây nhằm mục đích nâng cao nhận thức của bạn, nhưng không đưa ra hướng dẫn để thực hiện giao dịch
 Tiếng Việt

 Русский
 English
 Bahasa Indonesia
 Bahasa Malay
 ไทย
 Español
 Deutsch
 Български
 Français
 中文
 বাংলা
 हिन्दी
 Čeština
 Українська
 Română

