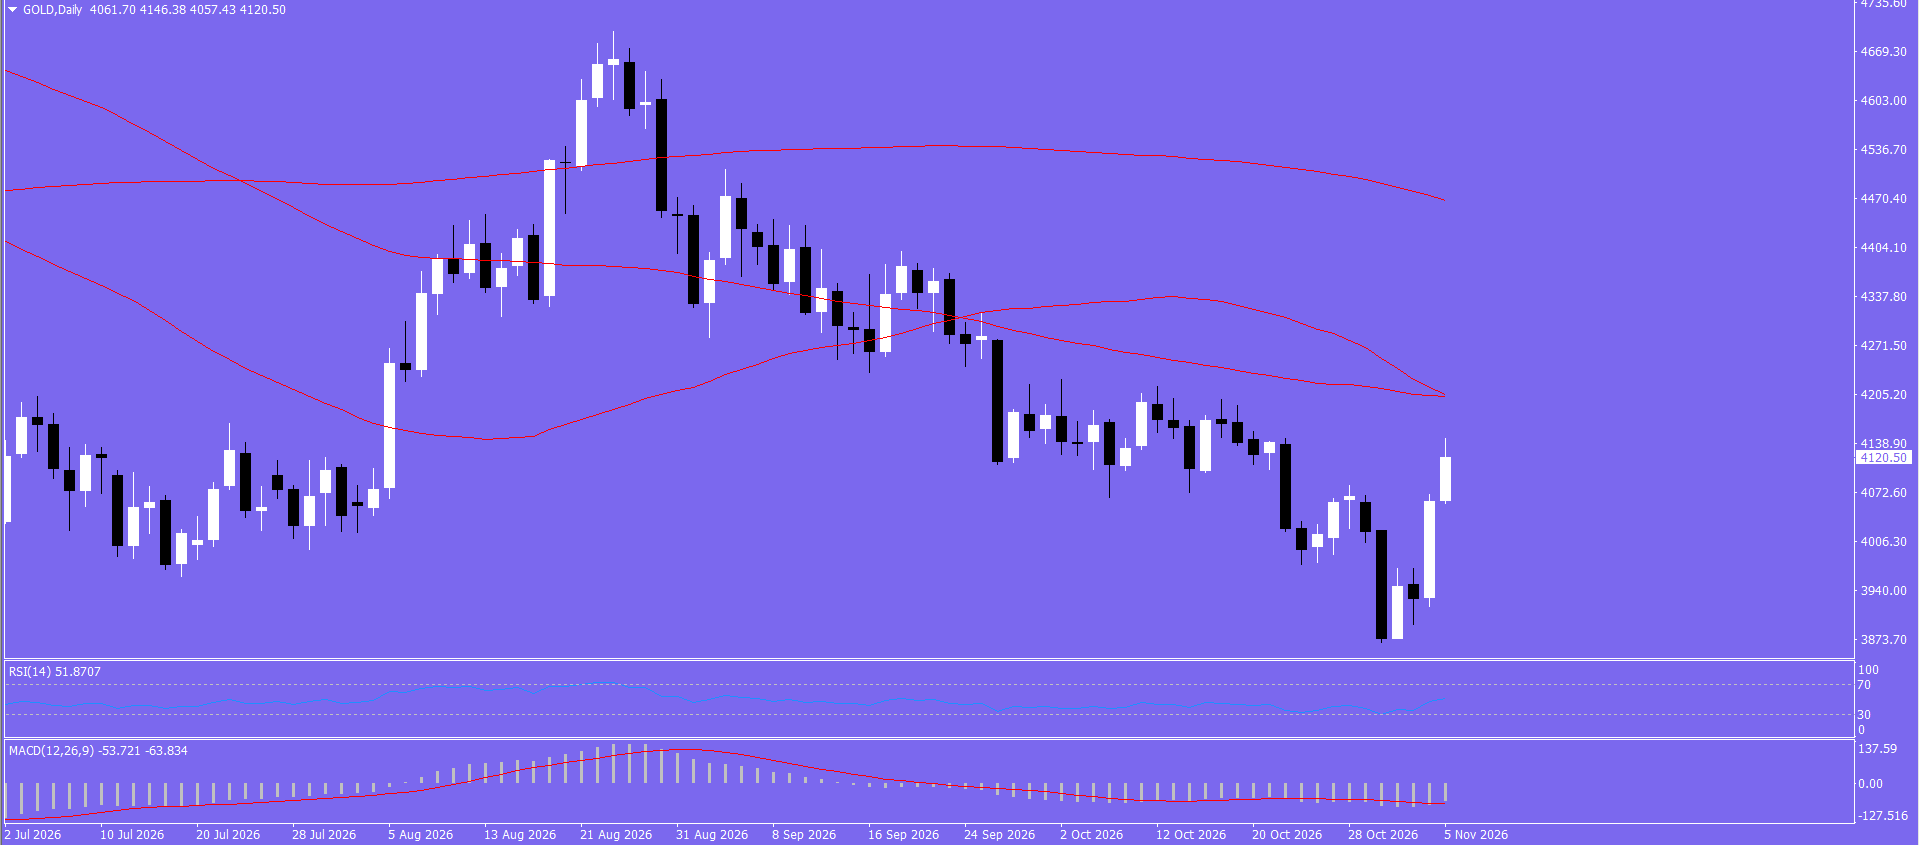
 Gold (XAU/USD) Daily Outlook Update
Gold (XAU/USD) continues to gain on Thursday, rising further from the year-to-date low of $3,870 set last week. Gold is a favourite among buyers amid the results of the US midterm election as markets remain volatile. Currently, XAU/USD is trading at about $4,130, close to two-week highs. The precious metal rose 3.64% on Wednesday. In comparison, WTI fell 8% as speculation grew that a Democratic sweep of Congress would hinder funds allocated to Trump's military operation against Iran and prompt him to end the war, which had been going on for nine months. Furthermore, the likelihood of a divided government eases worries about the country's financial health, since passing new tax cuts and spending deals may be tougher. This is bullish for Treasuries and lowers yields, which is bearish for the US Dollar (USD). Moreover, weaker oil prices also ease inflation fears. Collectively, these factors lead to higher demand for Gold. Nevertheless, pressure on the US Dollar, Treasury yields, and Oil prices dissipates on Thursday after Tuesday's massive sell-off, likely capping Gold's upside. At the same time, the Fed's tough stance is likely to weigh on the precious metal. Indeed, oil prices continue trading well above pre-war levels, suggesting inflation risks remain. Given that the Fed aims to bring inflation down to its 2% target, market participants anticipate higher interest rates for longer and even a December rate hike, with probabilities on the CME FedWatch Tool standing at around 79%. Focus is now on the employment situation in the United States, as it may shape expectations for the Fed's monetary policy. On Thursday, Initial Jobless Claims will be published, and on Friday, the NFP will be released. On the daily chart, XAU/USD continues to hold a capped bias, as price remains below the medium- and long-term moving averages. The 21-day simple moving average stands at $4,077 and currently supports the rebound. Meanwhile, the price remains below the 50-, 100- and 200-day moving averages. Momentum has increased, as the Relative Strength Index currently stands at 52, and Moving Average Convergence Divergence has turned positive, pointing to rising pressure. However, the structural bias remains to the downside. On the downside, the first support appears at the 21-day SMA at $4,077, followed by psychological support at the $4,000 level and then the year-to-date low at $3,870. At the upside, first resistance appears at the same 100-day and 50-day MAs at $4,203 and $4,206, respectively. More robust resistance appears at the 200-day moving average at $4,468. A clearA clear daily break above those moving averages will ease the current bearish bias.
* Phân tích thị trường được đăng ở đây nhằm mục đích nâng cao nhận thức của bạn, nhưng không đưa ra hướng dẫn để thực hiện giao dịch
 Tiếng Việt

 Русский
 English
 Bahasa Indonesia
 Bahasa Malay
 ไทย
 Español
 Deutsch
 Български
 Français
 中文
 বাংলা
 हिन्दी
 Čeština
 Українська
 Română

