logo

FX.co ★ bradtke.owen | CL/Crude Oil

CL/Crude Oil

Unraveling the Bearish Pressure on Crude Oil: Daily Chart Evaluation of Crude Light Sweet Oil (#CL)

CL/Crude Oil

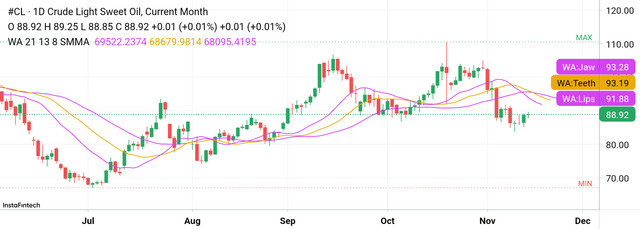
The dynamics of the global energy market once again present fairly sharp price movements to observe, particularly on the crude oil futures contract Crude Light Sweet Oil (#CL). Based on the daily chart (1D) observation from the InstaFintech platform, this commodity's movement shows a fairly deep correction phase after previously touching the highest area at elevated price levels. Let's dive deep into the strength map of the price action and the trend indicator readings accompanying the current price movement, presented in plain language. 1. Examining the Track Record of Movement and Price Action (Price Action) Rising Phase and Peak Highs: Starting in mid-year through October, the crude oil market recorded a very aggressive strengthening trend. The price climbed gradually from the lower base area around the 70.00 level and continued to ascend until it managed to breach the psychological boundary above 105.00 toward the end of October. Drastic Collapse Breaking Key Levels: However, that upward momentum suddenly failed when selling pressure massively dominated the market. Sharp consecutive declines occurred, during which a series of large red candles plunged through various important support levels in a relatively short time. Current Market Position: Currently, the trading price is observed at 88.92, with opening price (open) at 88.92, daily high (high) at 89.25, low (low) at 88.85, and recording a slight daily change of +0.01 (+0.01%). The price appears to be attempting to build a stable foothold after the collapse it experienced. 2. Reading the Williams Alligator Indicator Signals (WA 21 13 8 SMMA) On this daily chart panel is a trend indicator based on the Smoothed Moving Average popularly known as the Williams Alligator, using key parameters (21, 13, 8): WA:Lips (Lower Purple Line at 91.88): This fastest short-term trend line component is now positioned just above the current price, indicating that short-term control is still held by sellers. WA:Teeth (Yellow Line at 93.19): Serves as the medium balance line. Its position above the Lips line reinforces that the medium-term trend structure is in a corrective phase. WA:Jaw (Upper Purple Line at 93.28): Functions as a benchmark for the macro long-term trend. The Alligator lines contracting and positioned above the running price confirm that bearish dominance still looms over the commodity's room to move. 3. Considering Projections for the Market's Direction Ahead Seeing the price held below the 89.00 range and below all layers of the Alligator indicator lines, the market faces several possible scenarios: Continued Pressure Scenario (Bearish Pressure): If sellers again use the momentum to push the price down, room for weakness opens to retest lower psychological support areas below the current level. Consolidation and Recovery Scenario (Recovery Attempt): On the other hand, if the area around 88.00–89.00 succeeds in acting as a strong defensive floor, the #CL commodity has the potential to make a slow pullback movement to approach the Lips line area around 91.88.
* Phân tích thị trường được đăng ở đây nhằm mục đích nâng cao nhận thức của bạn, nhưng không đưa ra hướng dẫn để thực hiện giao dịch
Đi tới danh sách bài viết Đọc bài đăng này trên diễn đàn Mở tài khoản giao dịch