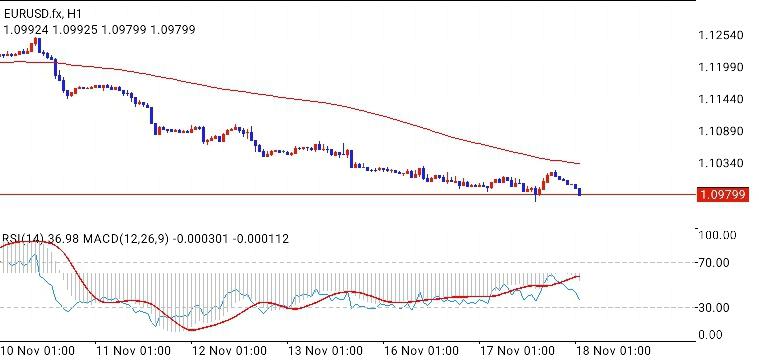
 EURUSD H1 Technical Outlook (as of 18 Nov 2026) Trend
: EURUSD is in a clear, persistent downtrend on the hourly chart. Price has fallen from roughly 1.1250 on 10 Nov to 1.0980 now, a decline of about 270 pips, forming a staircase of lower highs and lower lows. The long red moving average above price is sloping down steadily and currently sits near 1.1030, acting as dynamic resistance. Price has stayed below it for the entire period.
Price structure: The sharpest leg down came on 10-11 Nov, followed by a consolidation near 1.1170-1.1180. A second leg broke into the 1.0900-1.1000 area, then a slower grind lower. Over the last two sessions price has compressed in a narrow range around 1.0980-1.1000, with a small spike low near 1.0970 on 17 Nov that was quickly bought. The relief bounce to about 1.1010 failed, and price is now rolling over to 1.0979.
Momentum: RSI(14) reads 36.98, bearish but not oversold, so room remains for further downside before momentum is exhausted. The RSI recently touched the upper zone near 70 and reversed sharply, which confirms sellers are defending rallies. MACD (-0.000301 vs. signal -0.000112) is below its signal line and below zero, with the histogram turning negative again. That points to renewed downside momentum after a brief corrective pause.
Key levels: Resistance: 1.1000 (psychological), 1.1030-1.1040 (moving average and recent swing high), 1.1090 Support: 1.0970 (recent spike low), 1.0950, 1.0900
Scenarios: Bearish (primary): Price is rejecting the 1.1000-1.1010 area and the moving average is well overhead. A clean H1 close below 1.0970 would likely open a move toward 1.0950 and then 1.0900. Sellers would look for rallies into 1.1000-1.1030 with stops above the moving average, targeting the support levels above.
Bullish (alternative): The 1.0970 support has held multiple times, creating a potential base. A sustained break above 1.1030, with a close above the moving average, would signal a short-term trend shift and could target 1.1090. Given the RSI is not yet oversold and MACD is bearish, this scenario looks less likely without a catalyst such as weak US data or a hawkish ECB surprise.
Conclusion: The bias remains bearish while price trades below 1.1030. The tightening range near support suggests a breakdown attempt is possible, though repeated defense of 1.0970 means traders should watch for a false break. Use confirmation closes rather than anticipating the move, and size positions with the tight range in mind. Also watch for scheduled US and Eurozone data releases, since volatility around news can invalidate technical setups quickly. This is a technical read of the chart only, not financial advice. Trading carries risk, so manage position size and stops accordingly.
* Phân tích thị trường được đăng ở đây nhằm mục đích nâng cao nhận thức của bạn, nhưng không đưa ra hướng dẫn để thực hiện giao dịch
 Tiếng Việt

 Русский
 English
 Bahasa Indonesia
 Bahasa Malay
 ไทย
 Español
 Deutsch
 Български
 Français
 中文
 বাংলা
 हिन्दी
 Čeština
 Українська
 Română

